Introduction
Rheumatoid arthritis (RA) is a long-lasting condition affecting the entire body that is driven by immune system dysfunction. It is characterized by the elevation of inflammatory factors in the blood, the excessive growth of synovial tissue, and the deterioration of bone and cartilage. These pathological changes arise from combinations of inherited traits and environmental triggers [1, 2]. RA affects 0.1-2.0% of the global population [3]. Although it can manifest at any age, it appears most commonly in individuals in their 30s to 50s, with women being disproportionately more affected than men [4].
Evidence from numerous studies highlights the pivotal impacts of environmental elements on the initiation and progression of various autoimmune conditions [5-9]. The mechanisms by which climatic factors influence the immune system remain unclear. Specific weather conditions, including colder climates, high barometric pressures, and increased moisture levels, may contribute to the triggering of RA [10-13]. However, scientific evidence regarding initial triggering factors remains limited, and conclusions about biomarkers are inconsistent [14-17]. These discrepancies may be attributed to differences in the climatic conditions of the geographic regions in which studies have been performed and in the research methodologies employed.
Synergistic effects of meteorological factors and surface ultraviolet (UV) radiation can influence double-stranded DNA (dsDNA) [17-19]. As a type of extracellular circulating DNA, dsDNA has been recognized as an antigen that triggers immune responses in various autoimmune diseases, including systemic lupus erythematosus [20], systemic sclerosis [21], and primary Sjögren’s syndrome [22]. Hajizadeh et al. [23] emphasized the relationship between dsDNA and rheumatoid factor in patients with RA. Contemporary studies and therapeutic strategies for RA focus largely on the discovery of diverse serum biomarkers, including rheumatoid factor and anti-citrullinated, anti-carbamylated, and anti-acetylated protein antibodies [24]. Multiple studies have identified DNA-sensing autoimmune inflammatory pathways, but our understanding of the relationship between circulating dsDNA levels and the pathogenesis of RA, and of the role of seasonal meteorological parameters, remains limited. To address this research gap, we investigated differences in the peripheral circulating serum dsDNA level between patients with RA and healthy controls, and potential associations of this level with seasonal temperatures and UV radiation levels. The elucidation of patterns of seasonal variation in the dsDNA level in RA may provide insights into the disease’s pathogenesis and offer new directions for further research on the potential etiological role of dsDNA in RA.
Material and methods
Setting and participants
Our research group collected the case data in a tertiary hospital that provides care to more than 100,000 residents of a southern city in central and eastern China from September 2017 to October 2019. The participant dataset collected were the date of blood collection; patient sex, age, place of residence, past history, and family history; and RA clinical manifestations and treatment plans. All patients in the RA group fulfilled the 2010 European League Against Rheumatism/American College of Rheumatology criteria for RA and were diagnosed with the condition by rheumatologists. Subjects with concurrent autoimmune diseases and those who had previously received systemic immunosuppressive therapy were excluded. To mitigate potential bias, we employed propensity score matching (PSM) to healthy controls at a 1 : 3 ratio and caliper value of 0.2 using the MatchIt package in R (version 4.2.2; https://www.r-project.org/). We excluded cases with missing basic information (including those for which meteorological data were missing after PSM), and limited the sample to people living in the region to reduce errors such as time deviations due to differences in geographical and meteorological conditions and long-distance travel before treatment. The final sample comprised 152 participants with RA and 2944 healthy subjects who provided informed consent to study participation. Baseline data on the patients enrolled in the study are provided in Table 1. The hospital’s ethics committee approved the study.
Table 1
Baseline data of enrolled patients
Sample collection and handling
Qualified physicians collected two tubes of peripheral blood (3-6 ml each) from each participant. The samples were stored separately in sterile anticoagulant and procoagulant tubes. Fresh blood (0.5 ml) was drawn from the anticoagulant tube using a sterile nuclease-free pipette tip, aliquoted into several nuclease-free cryovials, labeled, and preserved in liquid nitrogen. The fresh blood in the procoagulant tube was centrifuged at 4°C and 4000 rpm for 30 minutes, and the supernatant was collected, aliquoted into cryovials, and stored at –80°C for long-term preservation.
Serum dsDNA detection
We used a quantitative method based on combined fluorescence detection to obtain serum dsDNA values. Using a commercial kit (cat. no. K900-2000-1; BioVision, USA), we prepared a 5 ng/ml dsDNA standard solution and diluted the 2X dsDNA dye with TE buffer and ultrapure water (18 MΩ•cm specific resistance). Then, 50, 48, 46, 44, 42, and 40 µl 1X TE buffer was added to a dark 96-well plate (Costar, Kennebunk, ME, USA) and 0, 2, 4, 6, 8, and 10 µl dsDNA standard solution was added to the buffer solution to obtain a reference standard curve. A 10-µl aliquot of each serum sample was added to 40 µl of buffer in a 96-well plate, and each sample was tested in triplicate (as technical replicates) to ensure accuracy. dsDNA dye (50 µl) was added to each well. The plate was then immediately covered and shaken in a box in the dark for 10 minutes. Finally, a cell imaging multi-mode reader (Cytation 5; BioTek, USA) was used to obtain a fluorescence value for each sample at 28oC and excitation and emission wavelengths of 480 and 530 nm, respectively. The initial concentration of dsDNA in each sample was calculated using this value and the standard curve.
Analysis of associations between dsDNA concentrations and concurrently recorded weather patterns
For a subsample of 152 patients with RA, weather data corresponding to the dates of disease onset (month and local monthly average temperature) and blood collection (UV index) were obtained through the online platform of China’s National Meteorological Information Center (http://data.cma.cn). Patients who first visited the hospital in November-April (monthly average temperatures of 1.2-16.4oC) were allocated to the low-temperature group, and those who first visited the hospital in May-October (monthly average temperatures of 17-32.3°C) were allocated to the high-temperature group. Based on the international standard Global solar UV index: a practical guide (WHO), the UV index data were used to allocate patients to high (≥ 7) and low (< 7) UV radiation intensity groups. The original dsDNA measurement data grouped according to temperature and UV intensity are shown in Table 2.
Table 2
dsDNA levels across temperature and UV exposure conditions
RNA isolation and quantitative PCR
Biochemical analysis was performed with samples from 30 patients with RA and 30 healthy controls. Their baseline characteristics are summarized in Table 3. Whole blood samples were frozen with Trizol (Invitrogen) at a 1 : 2 ratio and –80oC, then mixed with Trizol at a 1 : 3 ratio before RNA extraction according to the manufacturer’s instructions. The RNA was then reverse-transcribed into cDNA using the Evo M-MLV RT Kit and gDNA Clean for quantitative PCR (qPCR; Accurate Biology, Changsha, China). qPCR analysis was performed to detect dsDNA receptor genes using the StepOnePlus Real-Time PCR System (Applied Biosystems) and SYBR Green Premix Pro Taq HS qPCR Kit (Accurate Biology). The primers used are listed in Table 4. Gene expression was calculated using the 2ΔΔCT method with normalization to GAPDH.
Table 3
Characteristics of healthy controls and rheumatoid arthritis patients analyzed for gene expression analysis
| Group | Total (N) | Sex (male/female) | Average age (years) |
|---|---|---|---|
| Healthy control | 30 | 21/9 | 36 |
| Rheumatoid arthritis | 30 | 6/24 | 56 |
Table 4
Primers for quantitative PCR
Statistical analysis
Differences in gene expression and dsDNA levels were examined using Student’s t test. Relationships between dsDNA and biochemical parameters – blood pressure and glucose, alanine aminotransferase, aspartate aminotransferase, triglyceride, low-density lipoprotein (LDL), and high-density lipoprotein levels – were assessed using Pearson correlation analysis. For comparisons of non-normally distributed data among more than two groups (e.g., seasonal dsDNA values), the Kruskal-Wallis test with Holm’s adjustment for multiple comparisons and post-hoc pairwise Mann-Whitney U test were applied. The Mann-Whitney U test was also used for the pairwise comparisons of UV intensity among RA groups and of age between patients and controls. Categorical variables were evaluated using the chi-squared test. The independent-samples t test and chi-squared distributions were applied as appropriate for other comparative analyses. The analyses were performed using SPSS (version 23.0; IBM Corporation, Armonk, NY, USA). They were conducted with a focus on 95% confidence intervals, and the significance level was set to p < 0.05.
Results
Elevation of serum dsDNA levels in patients with RA
Participants’ demographic and clinical characteristics and corresponding weather-related data before and after PSM are summarized in Table 5. PSM eliminated significant differences in variables such as age and resulted in a final sample of 150 patients with RA and 408 healthy controls. The mean serum dsDNA concentration was significantly higher in the RA group than in the control group (1.16 ±0.36 ng/ml vs. 0.92 ±0.20 ng/ml; p < 0.001).
Table 5
Comparison of clinical characteristics before and after propensity score matching (PSM) in patients with rheumatoid arthritis and healthy controls
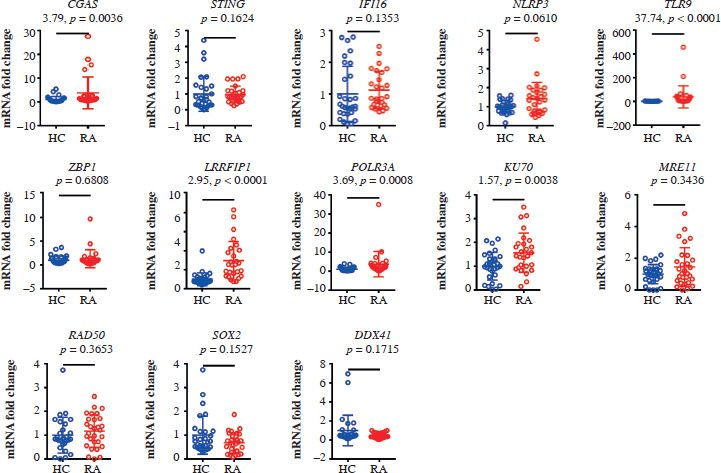
Upregulation of dsDNA receptor gene expression in patients with RA
The expression levels of CGAS, TLR9, LRRFIP1, POLR3A, and KU70 varied notably across the patient and control groups. LRRFIP1 and TLR9 expression levels were markedly elevated in patients with RA (p < 0.001), with LRRFIP1 showing the most pronounced elevation (t = 2.95, p < 0.001; Fig. 1).
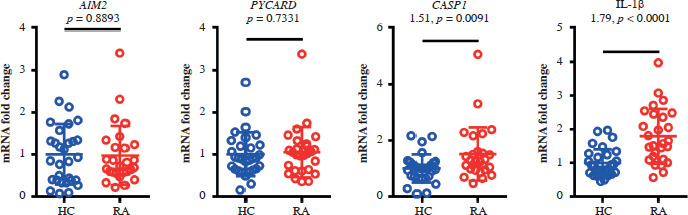
Upregulation of ALR inflammasome-related inflammatory factors in patients with RA
The expression of absent in melanoma 2 (AIM2) in whole blood samples did not differ significantly between the patient and control groups. The expression of the inflammation-related factors caspase 1 (CASP1) and interleukin 1β (IL-1β) was stronger in the RA group than in the control group (Fig. 2), suggesting that dsDNA activates the AIM2-associated molecular pathway.
Fig. 2
Significant differences in CASP1 and IL-1β expression between rheumatoid arthritis patients and healthy controls. Real-time PCR analysis was conducted on whole blood levels of AIM2, PYCARD, CASP1 and IL-1b in rheumatoid arthritis patients (n = 30) and healthy controls (n = 30), relative to GAPDH expression. Data are presented as the mean ± standard deviation (SD) from three independent experiments (n = 30)
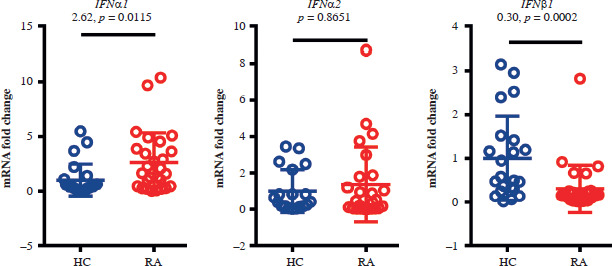
Elevation of type I interferon expression in patients with RA
The expression levels of type I interferon (IFN) α1 and IFNβ1 in whole blood samples were significantly higher in the RA group than in the control group. The gene expression level of IFNα2 was similar in the two groups (Fig. 3).
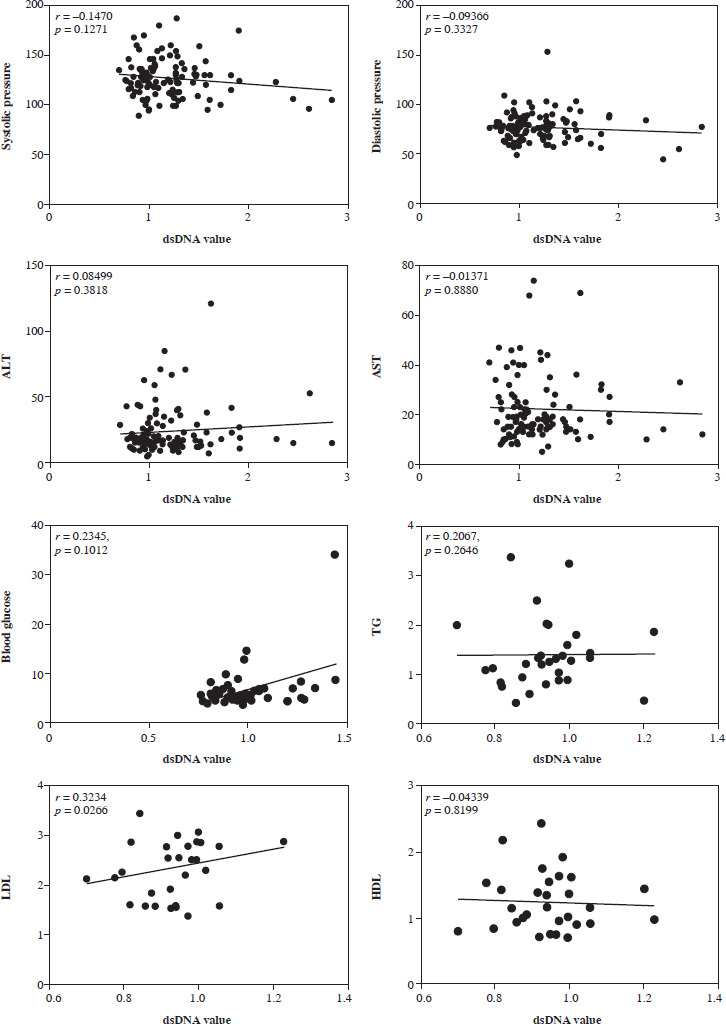
A very weak correlation was observed between LDL and dsDNA values in RA patients
We performed a correlation analysis between serum dsDNA values and various indicators, including glucose, blood pressure, alanine transaminase (ALT), aspartate transaminase (AST), triglycerides (TG), low-density lipoprotein (LDL), and high-density lipoprotein (HDL), in RA patients. Pearson correlation analysis was used to analyze the correlation between dsDNA and biochemical indicators. We found that serum dsDNA values were very weakly correlated with LDL levels (Fig. 4).
Correlation of serum dsDNA values with seasonal temperature and UV intensity in patients with RA
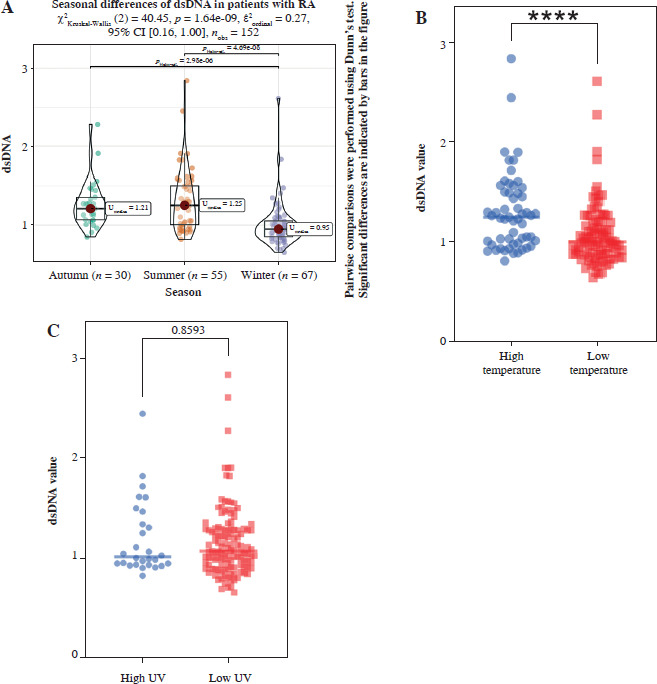
Among patients with RA, significant inter-group seasonal variations in dsDNA levels were observed among distinct rheumatoid arthritis patient populations across seasonal time points; they were higher during months with higher temperatures than during the low-temperature period. In contrast, the UV intensity had a minimal impact on the dsDNA level (Fig. 5).
Fig. 5
Correlation between serum dsDNA values and seasonal temperature and UV intensity in RA patients. A) Marked fluctuations in dsDNA levels were identified among rheumatoid arthritis patients across the seasons, with the highest levels recorded during the summer, correlating with increased environmental temperatures (n = 152). B) Elevated temperature conditions were associated with significantly higher dsDNA levels compared to lower temperatures (high temperature: n = 55; low temperature: n = 97; total N = 152). C) The study found no significant variation in dsDNA levels when comparing groups subjected to different intensities of UV radiation (high UV: n = 28; low UV: n = 124; total N = 152)
Discussion
Cell-free DNA in the peripheral circulation originates from various sources, including apoptotic cells and neutrophils undergoing NETosis [25]. Under resting conditions, dsDNA is in a state of immune tolerance and does not induce an inflammatory response. Under cellular damage or mitochondrial stress, some endogenous dsDNA undergoes subcellular localization changes, transforming into damage-associated molecular patterns (DAMPs) that can be recognized by the immune system. Pattern recognition receptors (PRRs) can detect DAMPs, such as self-proteins and nucleic acids released during cellular damage. Extracellular DNA is recognized by various DNA sensors through endocytosis, which then triggers an autoimmune response, inducing the expression of inflammatory cytokines. This study showed that serum dsDNA levels and dsDNA receptor expression are elevated in patients with RA relative to healthy controls. Toll-like receptors (TLRs) are PRRs located on cellular and intracellular membranes. They represent an immunological link among infection, tissue damage, and inflammation [26]. TLR9, a DNA sensor, exists in a steady state on endoplasmic reticulum and endosome membranes and can be activated by unmethylated CpG DNA derived from pathogens or by synthetic CpG oligodeoxynucleotides and DNA–protein complexes. Upon sensing DNA, TLR9 drives the interaction between TLR9 adapter proteins and myeloid differentiation factor 88, which further activates the inhibitor of nuclear factor-κB-α via IL-1 receptor-associated kinase 1. This process leads to activation of the transcription factor IFN regulatory factor 7 in the nucleus, thereby promoting the production of IFN-α and IFN-β, which initiate the T helper-αβ immune response [27-29]. The observation of elevated type I IFN expression in this study confirms the relationship between serum dsDNA and the inflammatory immune response in patients with RA.
The inflammasome is a multiprotein complex composed primarily of cytosolic sensors from the NLR and ALR families, the apoptosis-associated speck-like protein containing a CARD domain, and the effector protein pro-CASP1 [30]. The effector protein is converted into its enzymatically active form (the cysteine protease CASP1), which induces secretion of IL-1β. AIM2, a PRR with dsDNA as its explicit ligand, plays a crucial role in the sensing of intracellular environmental disturbances and pathogen invasion due to the widespread distribution of dsDNA in eukaryotic cells. Upon binding to dsDNA, AIM2 assembles a caspase-dependent inflammasome, ultimately cleaving pro-IL-1β to produce mature IL-1β and other pro-inflammatory cytokines [31-33]. Additionally, mitochondrial DNA released following mitochondrial damage can activate the nucleotide-binding domain, leucine-rich-containing family, pyrin domain-containing-3 (NLRP3) inflammasome in the cytoplasm, triggering auto-activation of CASP1 and cleavage of the IL-1β precursor to generate mature IL-1β [34]. Our serum sample analysis revealed elevated levels of inflammasome-related factors, including CASP1 and IL-1β, in addition to AIM2, in patients with RA, suggesting a correlation between the peripheral dsDNA level and inflammasome pathways in these patients. These findings point to the potential significance of dsDNA sourced from subcellular damage in this population and underscore the importance of further research on the application of inflammasome pathway inhibitors, such as caspases, in the treatment of RA. Furthermore, Wang et al. [35, 36] demonstrated that CASP1 inhibits the cyclic GMP-AMP synthase-stimulator of interferon genes (cGAS-STING) pathway, which aligns with our finding of no significant difference in the expression of the dsDNA receptors cGAS and STING between patients with RA and healthy controls.
LDL is the primary carrier of cholesterol in the peripheral circulation [37], and substantial evidence indicates that it plays significant roles in the initiation and progression of atherosclerotic cardiovascular disease [38, 39]. Findings from a recent study suggested that autoimmune diseases, including RA, can accelerate the onset of atherosclerosis and increase the cardiovascular disease risk [40]. Furthermore, LDL can activate the NLRP3 inflammasome, leading to upregulation of CASP1 and IL-1β and triggering an inflammatory response [41]. Our study results align with these findings, although the molecular mechanisms of LDL in the pathogenesis of RA require further exploration.
Research teams from Australia, the Netherlands, Sweden, Japan, and other countries have observed that the incidence of RA tends to peak in winter and summer [13, 17, 42, 43]. Partially consistent with these observations, the serum dsDNA levels of patients with RA were higher in summer than in autumn and winter in this study. This finding suggests that seasonal temperature changes influence immune activity by triggering certain physiological responses.
An early study indicated that the risk of RA relapse was increased during the summer, when solar UV radiation is at its highest [44]. However, more recent findings suggest that heat shock proteins released in response to UV radiation mediate a protective immune response through T-cell modulation in patients with RA [45, 46]. Additionally, UV radiation (290-315 nm wavelength) can convert 7-dehydrocholesterol into vitamin D3, and elevated vitamin D levels have been associated with reduced RA disease activity [47, 48]. Our analysis revealed no significant correlation between the serum dsDNA level and solar UV radiation intensity, potentially attributable to differences in patient behaviors, such as the use of sunscreen, which could mitigate the direct effects of UV radiation. Notably, the influence of meteorological parameters on UV radiation exhibits significant spatial heterogeneity. For instance, the co-occurrence of sub-zero temperatures and high UV indices in high-altitude regions demonstrates that warm weather is not a prerequisite for elevated UV radiation levels.
This study has certain limitations. As most patients experienced significant clinical improvement after RA treatment and very few patients’ symptoms persisted across seasons, the collection of relevant samples from the same patients in summer and winter was difficult. Thus, we did not capture continuous seasonal variations in the dsDNA level in the same individuals. However, our study design allowed us to explore seasonal differences between groups with RA onset in different seasons. In addition, we cannot ignore the potential impact of age differences, and stricter control of this confounding factor is needed in future research. Finally, the sample was relatively small and consisted of individuals residing in the region surrounding a single hospital. Multicenter research is needed to verify the study findings, and more in-depth research is needed to elucidate the mechanisms underlying the association of the peripheral dsDNA level with the development of RA. In addition, further research is needed to delineate the independent contributions of the temperature, UV radiation, and other seasonal factors to the pathogenesis of RA, as well as the complex interaction among these factors.