Introduction
Prostate adenocarcinoma (PRAD), a common form of cancer, is characterized by the uncontrolled proliferation of glandular cells inside the prostate tissue [1]. It carries a significant global burden, as reflected by high diagnosis and mortality rates, emphasizing its profound public health impact [2, 3]. The genesis of PRAD is rooted in a multifaceted interplay of genetic, environmental, and lifestyle determinants [4]. Primary among these are genetic predisposition, age, and hormonal imbalances, which are considered pivotal to PRAD development [5, 6]. Additionally, environmental factors, such as dietary habits, exposure to specific carcinogens, and inflammation, are potential catalysts in the disease’s onset [7]. Management strategies for PRAD are diverse, selected based on disease progression and individual patient profiles [8]. Active surveillance, surgery, and radiotherapy are preferred for low-risk scenarios, while advanced cases might necessitate interventions such as androgen deprivation therapy (ADT) [9]. Yet, even with these advancements, prognostic outcomes in PRAD are inconsistent, underscoring the urgent need for enhanced diagnostic markers, innovative therapeutic options, and reliable prognostic indicators. Given PRAD’s intricate nature and its broad clinical implications, there is an urgent need to identify groundbreaking diagnostic biomarkers, curate personalized treatments, and refine prognostic tools. Emerging strategies, such as pinpointing specific genetic anomalies or molecular signatures tied to PRAD, offer promising avenues for improved early detection and tailored therapeutic approaches.
First identified in 2002, RAB40C, a member of the RAS-related protein family, was initially characterized for its pivotal role in regulating intracellular vesicle trafficking [10-12]. However, its significance has since evolved, particularly in the domain of cancer research. RAB40C now stands in the spotlight, owing to its implications in tumorigenesis, metastasis, and cellular proliferation [13, 14]. Notably, a rigorous study by Wu et al. pinpointed RAB40C as an oncogenic immune protein and a predictive marker in lung squamous cell carcinoma [15]. Quantitative real-time polymerase chain reaction analysis conducted by Khakpour et al. found distinct methylation patterns in Rab40C across breast cancer patients [16]. Given the mounting evidence associating RAB40C with various cancer types, a deeper exploration of its molecular intricacies in PRAD is imperative. Such endeavors hold promise for spearheading breakthroughs in PRAD management and tailoring patient-specific therapeutic strategies.
In our investigation, we commenced with a bioinformatics analysis of the GSE6956 dataset, which pinpointed RAB40C as a pivotal gene intricately linked with PRAD. Based on this finding, we conducted in vitro cell studies to elucidate the functional dynamics of RAB40C and reveal its potential role in PRAD pathogenesis. The results of our research support the utility of RAB40C as a diagnostic biomarker and a therapeutic target for PRAD. A deeper understanding of the molecular mechanisms underlying PRAD may facilitate the development of enhanced diagnostic techniques and personalized interventions for this complex disease.
Material and methods
Downloading and processing of the GSE6956 dataset
The R program was used to preprocess the microarray data set from PRAD (GSE6956) that was retrieved from Gene Expression Omnibus (GEO, https://www.ncbi.nlm.nih.gov/gds/). The dataset includes samples of PRAD (n = 69) and their corresponding controls (n = 20). When numerous probe sets corresponding to the same gene were examined, the mean value of the expression of those probe sets was calculated. The probe ID was translated to the gene symbol and the differential analysis was performed using the Limma package of the R programming language. The threshold standard for fold change (FC) used was set to > 2 or < 0.5, and an adjusted p-value < 0.05 was considered significant.
Weighted gene coexpression network analysis (WGCNA)
A comprehensive analysis of differentially expressed genes (DEGs) in the GSE6956 dataset was performed using the WGCNA method. A gene co-expression network was created using the R language’s “WGCNA” package. The soft threshold power was set to β = 10 to guarantee a scale-free topology. The weighted adjacency matrix was converted into a topological overlap matrix (TOM), which provided a robust measure of network connectedness, after the network had been built. A dendrogram was created by the application of hierarchical clustering to TOM. In this structure, individual branches (shown in different colors) represent different gene modules. Using weighted correlation coefficients, DEGs exhibiting similar expression trajectories were merged into corresponding modules. Ultimately, we examined the correlation between gene modules and clinical traits to identify the key module.
Analysis of protein-protein interactions (PPIs) and functional enrichment
With the help of the Database for Annotation, Visualization, and Integrated Discovery (DAVID, https://david.ncifcrf.gov/tools.jsp), we carried out functional enrichment analysis to learn more about the biological importance of the blue modules that were found. This in-depth study covers concepts from Gene Ontology (GO) that are connected to Wikipathway annotations, cellular components (CC), biological processes (BP), and molecular functions (MF). Rich terms were visualized using the ggplot2 package in R to generate informative bubble plots highlighting rich categories. To elucidate potential protein interactions within the blue module, we performed PPI network analysis using the Interacting Gene Retrieval Search Tool (STRING, https://string-db.org/) database. Cytoscape, an open-source network visualization software platform, was then used to display the generated PPI network. The top 15 genes in the hub-gene ranking method (Maximum Neighborhood Component) are highlighted in the visualization, providing a concise overview of the central components of the network. When p < 0.05, the obtained results are statistically significant.
Gene expression analysis and survival prediction
Following the identification of the top 15 genes within the MNC, we conducted gene expression analysis in 498 PRAD samples and 52 control samples from The Cancer Genome Atlas (TCGA) to discern their expression patterns. To display the expression levels of these genes across the research samples, we created visually instructive box plots using R tools. Among these genes, nine exhibited statistically significant expression differences. The ideal lambda value was then determined by conducting Least Absolute Shrinkage and Selection Operator (LASSO) regression analysis on the nine genes under the guidance of 10-fold cross-validation. Based on an established risk model, we divided PRAD samples from TCGA into low-risk and high-risk groups based on the expression levels of these genes. This model facilitated the evaluation of survival status and time for each group. From this analysis, three prognostically significant genes with differential expression were identified. We further compared disease-free survival (DFS) prognoses between the two groups using Kaplan-Meier survival curves, calculating median survival times and determining the hazard ratio (HR) for the high-risk group. The “timeROC” package was then used to build receiver operating characteristic (ROC) curves, which we used to assess the model’s capacity for prediction. To measure the prognostic accuracy of the model, the area under the curve (AUC) values were calculated. A higher AUC indicates stronger predictive ability. P < 0.05 was used to define statistical significance.
Nomogram analysis on the 3 signature prognostic genes
Following the establishment of prognostic gene signatures from the risk model, a comprehensive assessment of these genes was conducted using the “forestplot” package. Each of the prognostic genes underwent univariate and multivariate Cox regression analysis, which produced crucial statistical metrics including p-values, hazard ratios (HR), and 95% confidence intervals (CI). A key prognostic gene was chosen based on the size of its related p-value using the outcomes of the multivariate Cox regression analysis. Subsequently, a nomogram was constructed to visually represent the prognostic impact of the selected genes. In addition, the scores of various clinical indicators were summed to obtain a total score to quantitatively evaluate the predictive accuracy of prognostic genes affecting patients’ 1-year, 3-year, and 5-year survival.
Identification of potential RAB40C-interacting substrates using UbiBrowser database
To further investigate the molecular interplay involving RAB40C, we employed the UbiBrowser database to identify potential protein substrates that might interact with RAB40C. The UbiBrowser database, a comprehensive resource for ubiquitin and ubiquitin-like protein conjugation data [17], provided insights into the top 20 protein substrates that might be associated with RAB40C. This database-driven approach aims to elucidate the molecular mechanisms underlying RAB40C function and its potential interacting partners in the cellular context.
Expression analysis of RAB40C and SNX9 in UALCAN database
We used the UALCAN database (http://ualcan.path.uab.edu/) to clarify the possible relationship between RAB40C expression and clinical features in PRAD patients. Clinical data pertaining to PRAD patients were obtained, encompassing diverse parameters such as sample types, patient’s race, patient’s Gleason score, molecular signature, TP53 mutation status, and nodal metastasis status. Using the UALCAN platform, we stratified PRAD patients into distinct clinical subgroups based on the provided parameters. By analyzing RAB40C expression levels across these different clinical subgroups, our objective was to identify potential associations between RAB40C expression and the diverse clinical characteristics under investigation. Additionally, using the same UALCAN database, we examined the expression levels of SNX9 in PRAD tumors within the TCGA database.
Cell lines and cell culture
PRAD cells (22RV1, DU145, PC3) and normal prostate epithelial cells (RWPE-1) were provided by the ATCC and then cultured in RPMI-1640 media supplemented with 10% fetal bovine serum (FBS) and 1% penicillin-streptomycin at 37°C in a humid incubator with 5% CO2. 293T cells, commonly used for transient expression studies, were cultured under similar conditions. The transfection efficiency of FLAG-tagged RNF126 overexpression plasmid was assessed in the 293T cell line.
Cell treatment
Following specific transfections, 293T cells were subjected to various treatments. After 24 hours of transfection with either FLAG-RAB40C or GFP-SNX9 plasmids, cells were treated with agents such as DMSO, 10 µM MG132 (#S2619, Selleck), or 20 µM chloroquine (CQ, #S8808, Selleck) for an additional 8 hours. After being transfected with si-RAB40C or FLAG-RAB40C plasmids, 293T cells were intermittently treated with µg/ml cycloheximide (CHX) at certain intervals (0 h, 4 h, 8 h, and 12 h) to test the stability of the protein. In another set of experiments, after a 36-hour co-transfection period with HA-Ub, GFP-SNX9, and FLAG-RAB40C, cells were treated for 8 hours with 10 µM MG132 or DMSO, serving as a proteasomal degradation inhibitor.
Cell transfection
PRAD cells were seeded at a density of 2 × 10⁵ cells per well in 24-well plates for transient transfection. Transfection of the plasmid encoding RAB40C into PRAD cells using an appropriate transfection method allows the transfected cells to express the RAB40C protein for a specific period of time to achieve overexpression. Then, to effectively knock down the expression of SNX9, a particular small interfering RNA (siRNA) targeting SNX9 was transfected into PRAD cells. The cells were then incubated for the required duration. According to the manufacturer’s instructions, Lipofectamine 3000 (Invitrogen, USA) was used to transfect cells. Plasmid or siRNA was added to 25 µl of OptiMEM, and 2 µl of Lipofectamine-3000 (Invitrogen, USA) was mixed with a second portion of 25 µl of OptiMEM. After 5 min they were mixed and the plasmid or siRNA complexes were added to the cells 20 min later. The cells were then cultured for the time required for subsequent experiments.
Quantitative reverse transcription polymerase chain reaction (qRT-PCR)
TRIzol (Thermo Fisher Scientific) was used to extract total RNA from the cells, and a PrimeScript RT Reagent Kit (Takara) was used to reverse-transcribe the recovered total RNA into cDNA. On a Real-Time PCR System (Applied Biosystems), qRT-PCR was carried out using SYBR Green Master Mix (Thermo Fisher Scientific). The primer sequences for RAB40C were: forward 5′-AGCTGGTGTGGAGATGACG-3′, reverse 5′-TGTGAGGGCTTGTTGTAGTG-3′, and for SNX9 were: forward 5′-TCAGCTCCTCTTCCTGTCTG-3′, reverse 5′-AGGACCTGTCCTTGTGGTGT-3′. GAPDH forward: 5′-CAAGCTCATTTCCTGGTATGAC-3′ and reverse: 5′-CAGTGAGGGTCTCTCTCTTCCT-3′. The RAB40C and SNX9 expression was analyzed using the 2ΔΔCT method.
Western blot (WB)
Using protease and phosphatase inhibitors, protein lysates were extracted using RIPA buffer (Thermo Fisher Scientific). The BCA Protein Assay Kit from Thermo Fisher Scientific was used to calculate the protein concentration. SDS-PAGE was used to separate equal quantities of protein, which were then transferred to PVDF membranes (Millipore). The relevant primary antibodies against RAB40C, SNX9, CTGF, CDX2, and CYR61 (all at 1 : 1000, Abcam, USA) and GAPDH (Cell Signaling Technology, 1 : 5000, Abcam, USA) were then incubated on the membranes, followed by HRP-conjugated secondary antibodies (Santa Cruz Biotechnology, 1 : 5000, Abcam, USA). Enhanced chemiluminescence (ECL) substrate from Thermo Fisher Scientific was used to visualize protein bands.
Cell counting kit-8 (CCK-8) assay
Cell viability was evaluated using the CCK-8 test (Dojindo, Japan). PRAD cells were seeded in 96-well plates at a density of 5 × 10³ cells per well. The CCK-8 reagent was added to each well at specified time points (1, 2, 3, 4, and 5 days after treatment), and the plates were incubated according to the manufacturer’s instructions. A Thermo Fisher Scientific (USA) microplate reader was used to detect absorbance at 570 nm.
Flow cytometry for cell cycle analysis
PRAD cells were dissociated using trypsin-EDTA (Gibco, USA) and then cleaned with phosphate-buffered saline (PBS). As directed by the manufacturer, the cells were treated with fluorescently tagged RAB40C and SNX9-specific antibodies (Abcam, USA). The distribution of cells in various stages of the cell cycle was evaluated using FlowJo software (FlowJo LLC, USA), and flow cytometry was carried out using a flow cytometer (BD Biosciences, USA).
Co-immunoprecipitation (Co-IP)
FLAG-RAB40C and GFP-SNX9 plasmids were transfected into 293T cells, and the cells were then grown for 36 hours. After that, cells were lysed using RIPA buffer that included contained phosphatase and protease inhibitors. The BCA Protein Assay Kit was used to measure the protein content in the lysates. For the co-immunoprecipitation, lysates were incubated with antibodies specific to FLAG or GFP, followed by protein A/G agarose beads. The immunoprecipitated complexes were eluted and subjected to SDS-PAGE after several washes. The isolated proteins were then transferred to PVDF membranes and examined using FLAG-RAB40C and GFP-SNX9 antibody probes. An enhanced chemiluminescence (ECL) kit was used to visualize the bands, and a ChemiDoc imaging system was used to record them.
Transwell assay
Transwell chambers (Corning) were employed for the migration and invasion experiments. Cells were seeded without Matrigel in the top chamber to encourage migration. For invasion assays, chambers pre-coated with Matrigel were used. Non-migrated cells on the upper surface of the membrane were delicately removed using a cotton swab after the stipulated migration or invasion period. 4% paraformaldehyde was used to fix invading and migrating cells on the lower surface of the membrane, and DAPI was used to highlight the cell nuclei. After the excess dye was removed, a fluorescence microscope was used to visualize and count the invading or migrating cells.
Statistical analysis
Data were examined using the program GraphPad Prism (version 8, GraphPad Software, USA). Results are reported as the mean ± standard deviation (SD) of all trials, which were all carried out in triplicate. Following a post hoc Tukey’s multiple comparison test, statistical significance was established using Student’s t-test or one-way analysis of variance (ANOVA). Statistical results were deemed significant at p < 0.05.
Results
Optimized WGCNA analysis reveals key gene co-expression patterns in PRAD
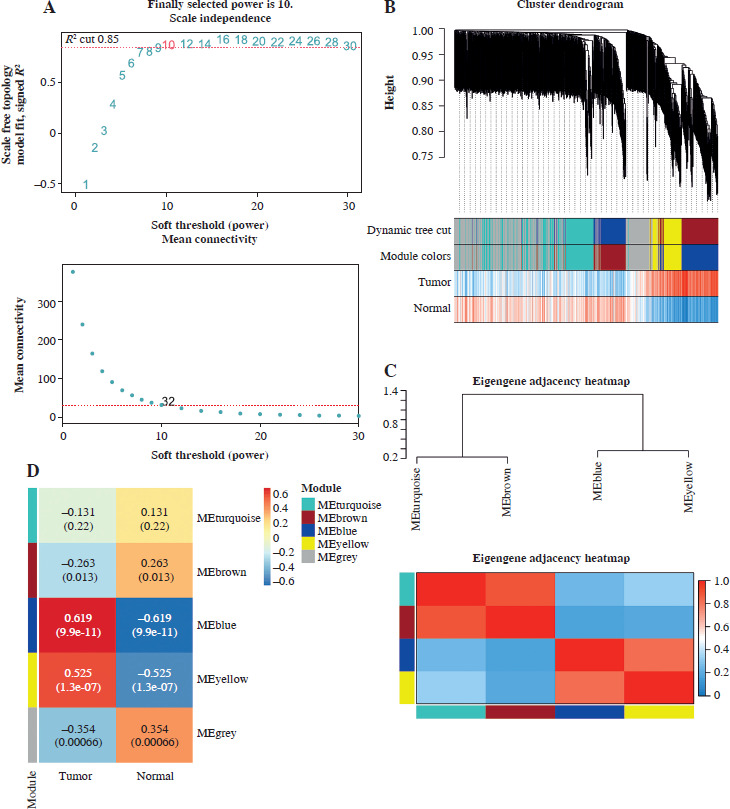
In probing gene coexpression signatures associated with PRAD, we leveraged the WGCNA method. By adjusting the power parameter to 10, we attained a scale independence of 0.85, indicative of module autonomy complemented by pronounced connectivity (Fig. 1A). Using this optimal power, we structured a co-expression module, effectively charting initial gene clusters. The ensuing WGCNA data yield a lucid overview of the modules, each color-coded for distinction (Fig. 1B). Prioritizing the integrity of our insights, we conducted outlier detection through hierarchical clustering of module eigengenes. Then, closely located branches were merged, setting the threshold at an intercept of 0.6 (Fig. 1C). A subsequent correlation study between module signature genes and distinct clinical attributes revealed strongly correlated modules. Notably, the blue module, populated by blue-marked genes, showed a strong positive correlation with PRAD. The correlation coefficient was relatively high (cor = 0.619), warranting further clarification (Fig. 1D). Scatterplots further elaborate on the relation, drawing parallels between gene membership in the blue modules and PRAD, underlining the interplay between module membership and gene significance in PRAD (Fig. 1E, F).
Fig. 1
Exploration of gene co-expression signatures in PRAD by WGCNA analysis. A) The upper panel presents the scale-free fit index (R2) for various soft-thresholding powers, while the lower panel illustrates the mean connectivity of modules. B) The dendrogram illustrates gene clustering based on their dissimilarity, with the dynamic tree cut method used to define modules. C) Robustness assessment by outlier detection and pooling. Hierarchical clustering of module eigengenes is performed to detect outliers. D) Module-trait heatmap displays correlations between modules and clinical traits (tumor and normal). Each cell contains the correlation coefficient and the p-value in parentheses, with the color intensity and direction (blue to red) reflecting the degree and nature of the correlation E) Scatter plot of relationship between gene significance in tumors and module membership in the blue module. F) Scatter plot of correlation between gene significance and blue module membership for normal samples
Functional insights and network interactions within the blue module
As the MEblue module has annotations for BP, CC, MF, and Wikipathway, we performed functional enrichment analysis to identify its crucial functions. This module is associated with PRAD-critical pathways such as ‘smooth muscle contraction’ and ‘cardiomyocyte development’ (BP), ‘cell-matrix junctions’ and ‘focal adhesions’ (CC), and ‘ankyrin binding’ and ‘insulin-like growth factor binding’ (MF). Wikipathway insights indicate links with the ‘IL-6 signaling’ and ‘Gastrin signaling’ pathways, suggesting a molecular underpinning in PRAD (Supplementary Fig. 1A-D). Using PPI network analysis, the intricate connections within the MEblue module were elucidated. The network consists of 54 nodes and 54 edges, depicting the intertwined relationships in the PRAD functional landscape (Supplementary Fig. 1E). A narrowed focus on the top 15 genes in MNC yielded a network of 15 nodes and 23 edges, spotlighting pivotal molecular interactions (Supplementary Fig. 1F).
Prognostic insights revealed through key gene expression analysis
We undertook a detailed differential expression analysis of the chosen 15 genes, highlighting that 9 of these genes showed significant expression differences (Supplementary Fig. 2A). We then honed in on these 9 genes for further prognostic evaluation. Through LASSO regression, we found an optimal lambda min value of 0.0179, depicted in Supplementary Figure 2B, C. An analysis was performed to create a prognostic risk model based on the significant expression patterns of these 9 genes in PRAD tumor tissues. This analysis singled out three pivotal genes for the risk model: PGM5, RAB40C, and MARK2. Their expression profiles in PRAD samples are presented in Supplementary Figure 2D. The results of a subsequent DFS study comparing the high-risk and low-risk groups revealed that the high-risk group had a higher prognosis for survival than the low-risk group, as shown in Supplementary Figure 2E. With AUC values of 0.749, 0.692, and 0.611 in the first, third, and fifth years, respectively, ROC analysis of this risk model confirmed its usefulness (Supplementary Fig. 2F).
Fig. 2
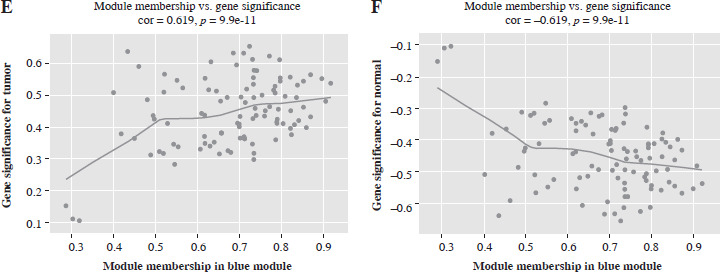
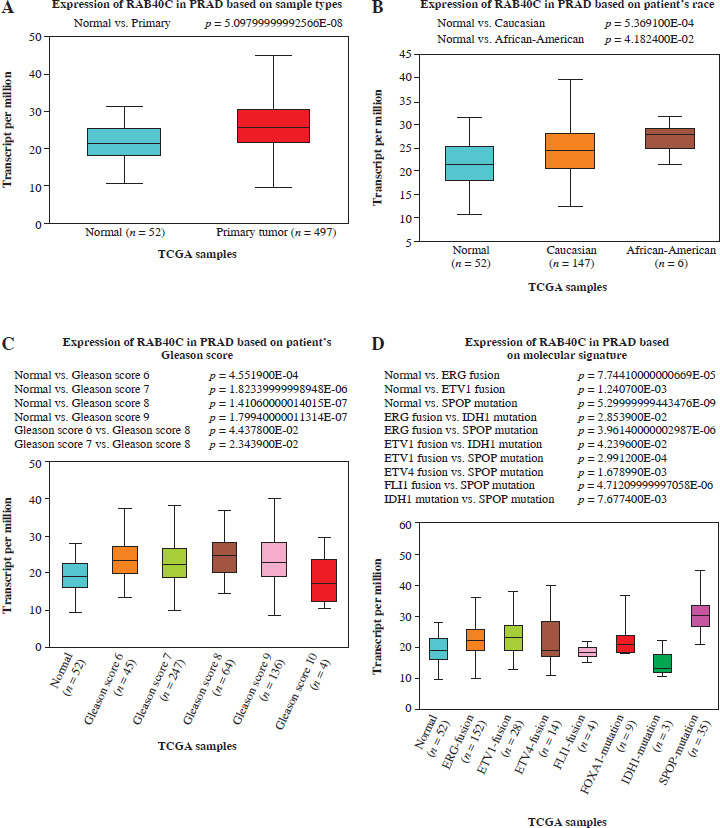
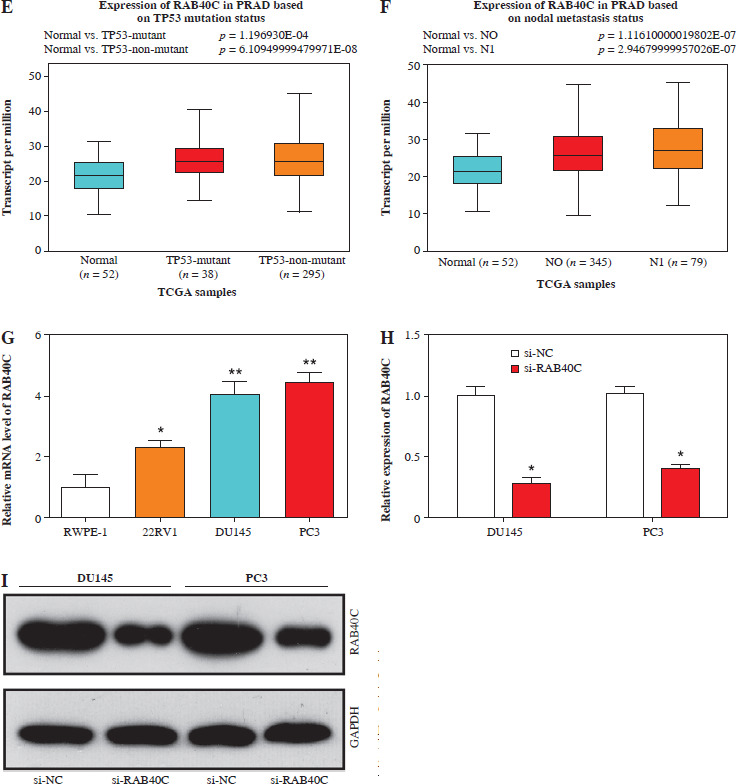
Expression analysis of RAB40C in public databases and PRAD cells. A) UALCAN database analysis detects expression of RAB40C in PRAD primary tumor samples. B-F) UALCAN database detects expression of RAB40C in different clinical characteristics, including B) race, C) Gleason score, D) molecular signature E, F) UALCAN database detects expression of RAB40C in different clinical characteristics, including E) TP53 mutation status, and F) nodal metastasis status. G) qRT-PCR analysis of RAB40C expression in normal prostate epithelial cells and three PRAD cells. H, I) qRTPCR and WB detects knockdown efficiency of RAB40C in DU145 and PC3 cells. *p < 0.05, **p < 0.01
Identification of prognostic hub genes in PRAD
We conducted univariate and multivariate Cox regression analysis after identifying the three key prognostic genes to assess their prognostic importance in PRAD. With each analysis having a p value < 0.05, these studies demonstrated substantial prognostic significance (Supplementary Fig. 3A, B). Harnessing these insights, a predictive model was constructed, demonstrating a commendable C-index of 0.772 (Supplementary Fig. 3C). Notably, the calibration curve best aligned with the model prediction at the one-year mark, followed by three and five years (Supplementary Fig. 3D). Given its robust predictive capability, RAB40C was designated as a central gene warranting deeper exploration in subsequent studies.
Fig. 3
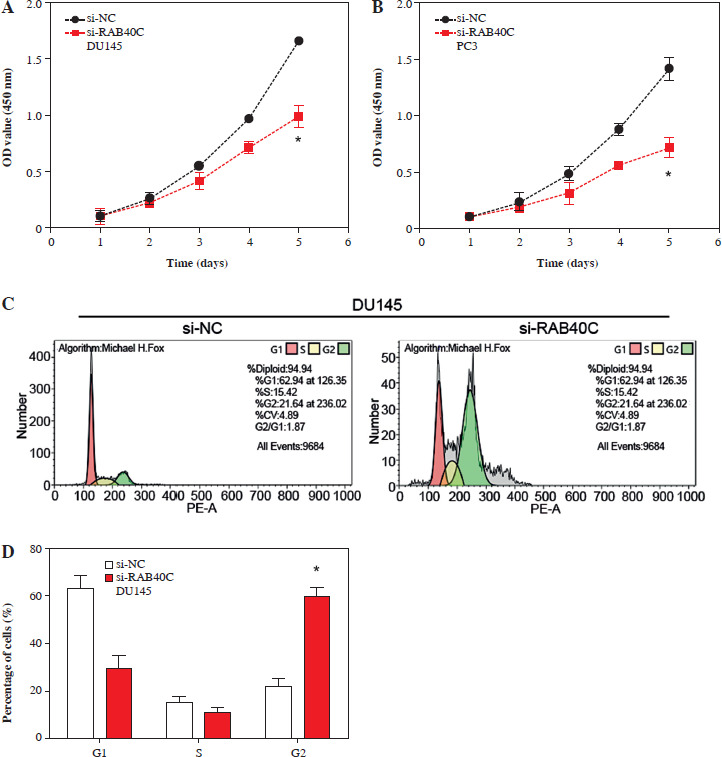
Effects of RAB40C knockdown on cell proliferation, cell cycle distribution and cell migration rate in PRAD cell lines. A, B) Cell proliferation assay, growth curves of DU145 (A) and PC3 (B) cells after 6 days of treatment with si-NC and si-RAB40C. The y-axis represents the OD value at 490 nm, representing cell viability. C-F) Cell cycle analysis, flow cytometry histograms showing G1, S, and G2 cell cycle phases of DU145 (C) and PC3 (D) cells treated with si-NC or si-RAB40 E, F) The percentage of cells at each cell cycle stage. G) WB analysis of cyclin D1 and CDK4 protein expression levels in DU145 and PC3 cells after RAB40C knockdown. H, J) Transwell migration assay, representative images of migrating DU145 (H) and PC3 (J) cells after treatment. Cells were stained with DAPI (blue). I, K) Quantification of invasion and migration, bar graph showing relative numbers of invaded and migrated DU145 (I) and PC3 (K) cells after treatment. *p < 0.05
RAB40C expression and clinical expression characteristics
Utilizing the UALCAN database, we observed augmented expression of RAB40C in primary tumor specimens, implying its potential oncogenic function (Fig. 2A). Interestingly, factors such as patient race, TP53 mutation status, and lymph node metastases had no impact on RAB40C expression in PRAD. RAB40C expression, however, was found to significantly correlate with patient Gleason scores as well as certain molecular characteristics (Fig. 2B-F). Through qRT-PCR analysis, the expression of RAB40C in PRAD cells was analyzed (Fig. 2G). Our data unambiguously showed upregulated expression of RAB40C in PRAD cells (namely, 22RV1, DU145, and PC3 cell lines) when contrasted with the RWPE-1, a standard for normal prostate epithelial cells. This heightened expression was particularly evident in the DU145 and PC3 lines, leading us to select them for further experimentation. The effects of RAB40C silencing on PRAD cells were subsequently explored using qRT-PCR and WB (Fig. 2H, I). After knockdown, RAB40C levels were significantly reduced, underscoring its importance in the pathogenesis of PRAD.
Knockdown of RAB40C inhibits malignant progression of PRAD cells
In PRAD cells, following the knockdown of RAB40C, the CCK-8 assay highlighted a significant decrease in cell proliferation (Fig. 3A, B). Flow cytometry further revealed alterations in the cell cycle after knockdown (Fig. 3C-F). An increase in G2 phase cells was observed, indicating a blockade at the G2 phase, suggesting that RAB40C may be involved in cell cycle regulation. This was supported by in vitro research, as shown by a WB analysis showing a substantial reduction in the expression of the cell cycle-associated proteins cyclin D1 and CDK4 (Fig. 3G). Using the Transwell assay, we determined the effects of RAB40C knockdown on PRAD cell capabilities for invasion and migration, which resulted in a marked decline in both cell movement and invasion capacity (Fig. 3H-K).
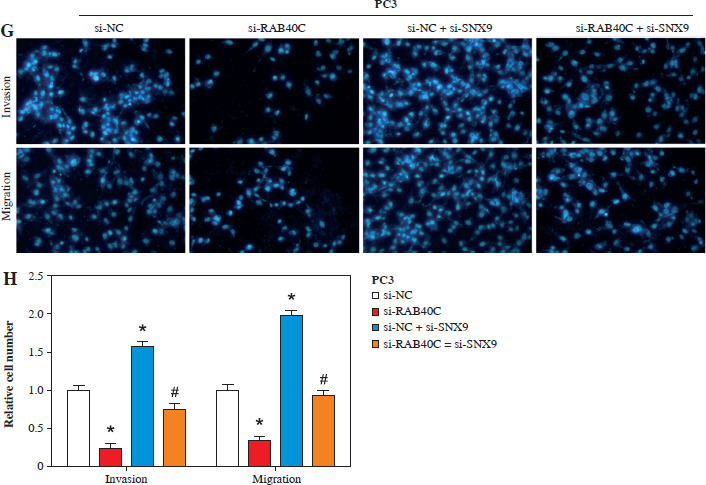
RAB40C reversely regulates SNX9 protein levels in PRAD cells
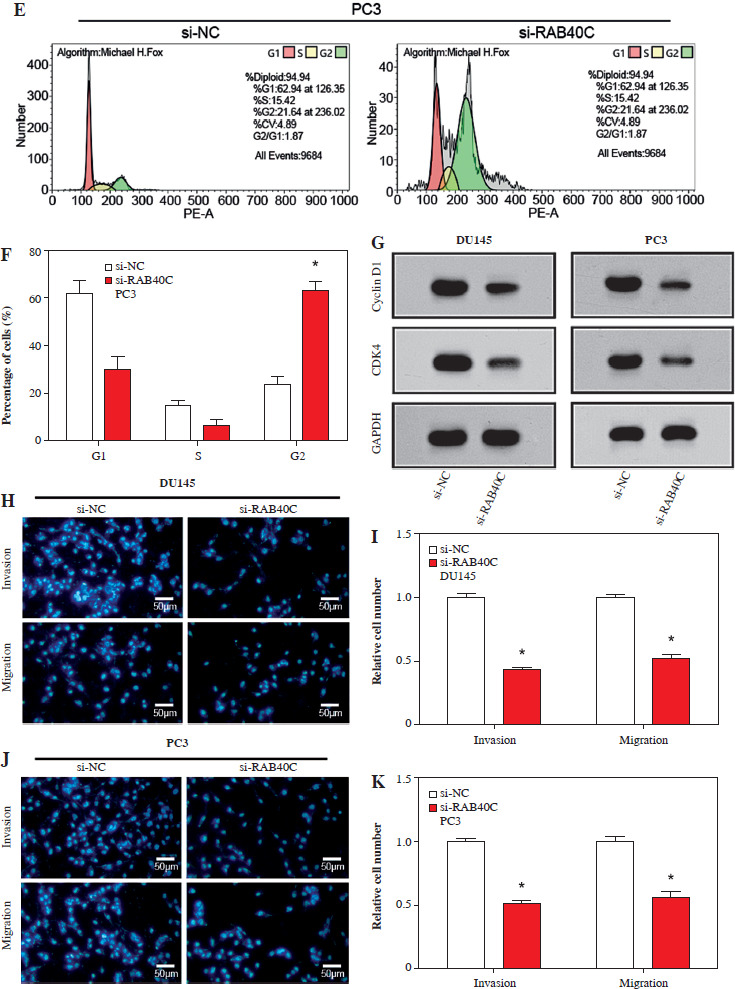
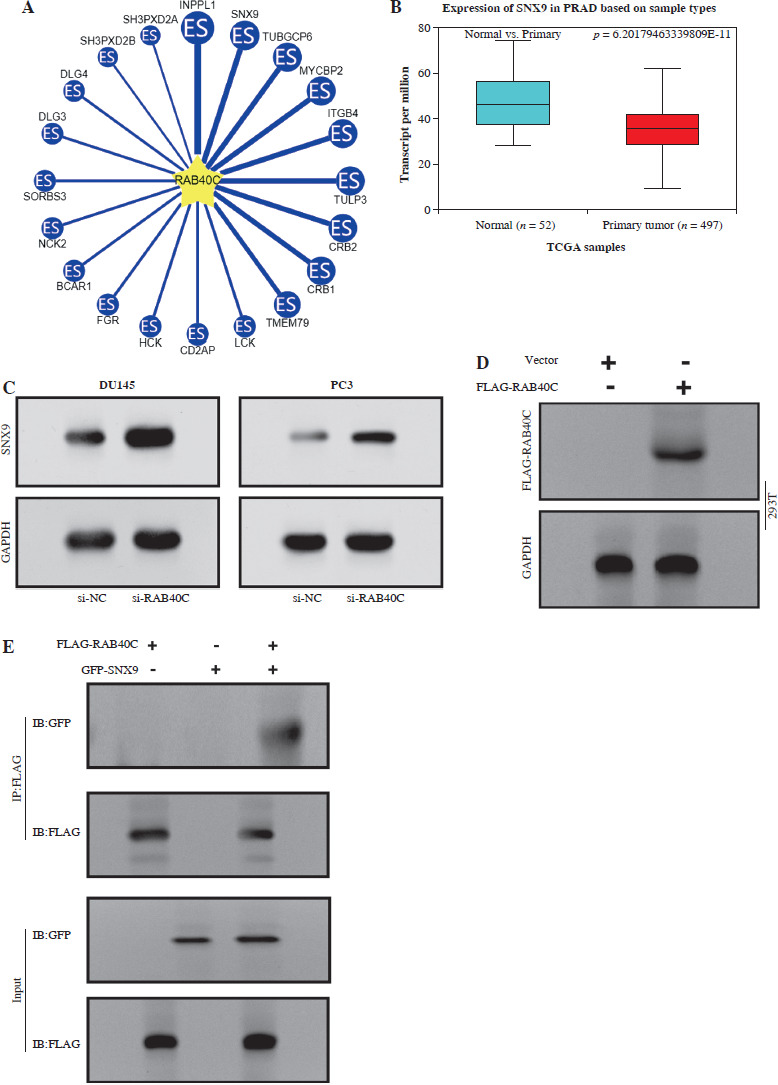
The UbiBrowser database analyzed the top 20 substrate proteins interacting with RAB40C, as illustrated in Figure 4A. Among them, we selected SNX9 for examination. The results indicated that this gene is underexpressed in TCGA-PRAD samples, suggesting its potential role as a tumor suppressor gene (Fig. 4B). WB analysis indicated a substantial rise in the expression of SNX9 in PRAD cells after RAB40C was silenced, indicating a potential inverse regulatory association between them (Fig. 4C). Moreover, overexpression of the FLAG-tagged RNF126 plasmid resulted in a marked enhancement of transfection efficiency in 293T cells (Fig. 4D). Investigating the changes of SNX9, co-IP elucidated the connection between RAB40C and SNX9. In 293T cells overexpressing both, an interaction between FLAG-RAB40C and GFP-SNX9 was observed, strengthening their direct association (Fig. 4E). When introducing GFP-tagged SNX9 and FLAG-tagged RAB40C plasmids into 293T cells, the upsurge in exogenous RAB40C expression correlated with a decline in exogenous SNX9 protein levels. This suggests a potential role for RAB40C in regulating SNX9 stability (Fig. 4F).
Fig. 4
Regulation of SNX9 by RAB40C in PRAD cells. A) Top 20 substrate proteins interacting with RAB40C as derived from the UbiBrowser database. B) Box plot, the expression levels of SNX9 in TCGA-PRAD samples and normal samples. The comparison between normal (n = 52) and primary tumor (n = 497) samples is displayed, with a significant p-value indicated. C) WB analysis of SNX9 protein expression in DU145 and PC3 PRAD cell lines after treatment with si-NC and si-RAB40C. GAPDH is used as a loading control. D) Overexpression efficiency of FLAG-tagged RNF126 plasmid in 293T cells confirmed via WB, with the presence of FLAGRAB40C bands and GAPDH as a control. E) Co-IP assay in 293T cells overexpressing FLAG-RAB40C and GFP-SNX9. Immunoblots for GFP (IB:GFP) and FLAG (IB:FLAG) in IP samples and input samples demonstrate a direct interaction F) WB detection of expression levels of GFP-SNX9 and FLAG-RAB40C in 293T cells after co-transfection
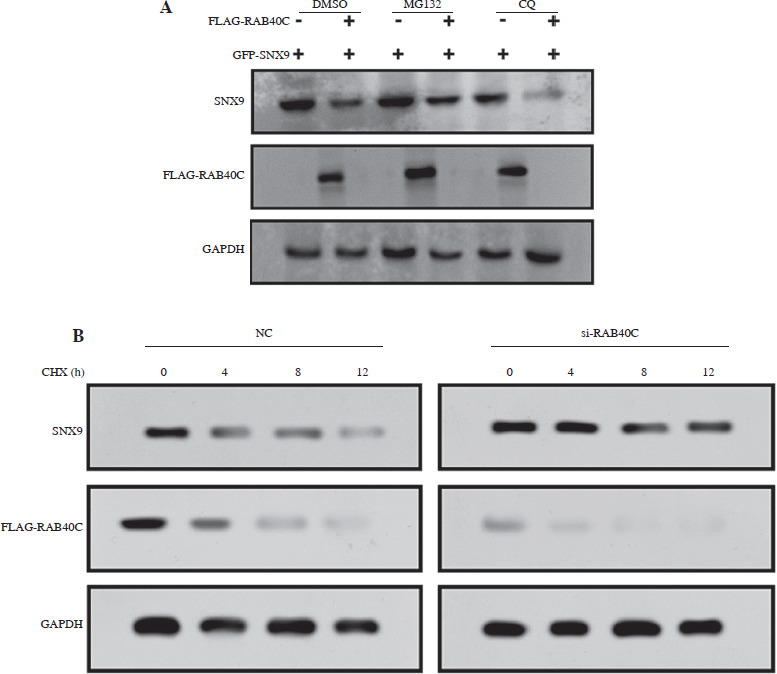
RAB40C regulates SNX9 stability in a ubiquitin-proteasome-dependent manner
In contrast to the autophagy inhibitor CQ, treatment with the proteasome inhibitor MG132 hindered the degradation of SNX9 induced by RAB40C (Fig. 5A). This underscores the critical involvement of the proteasomal pathway in the degradation process. We found that the rate of SNX9 degradation was slowed down in the absence of RAB40C using CHX chase assays (Fig. 5B). Conversely, the overexpression of RAB40C accelerated the degradation of SNX9 (Fig. 5C). We carried out an in vivo ubiquitination test to further explore the possible regulatory function of RAB40C in SNX9 ubiquitination. The results from immunoprecipitation indicated that the overexpression of RAB40C substantially augmented the polyubiquitination of SNX9 in 293T cells, an effect further amplified upon MG132 treatment (Fig. 5D).
Fig. 5
RAB40C modulates SNX9 stability via the ubiquitin-proteasome pathway. A) WB analysis of 293T cells co-transfected with GFP-SNX9 and FLAG-RAB40C under the treatments of DMSO (control), MG132 (proteasome inhibitor), and CQ (autophagy inhibitor). B) CHX chase assay revealing SNX9 degradation rates in cells under normal conditions (NC) and with si-RAB40C treatment over a 12-hour period C) Degradation rates of SNX9 in 293T cells transfected with either vector control or FLAG-RAB40C, as monitored over a 12-hour interval post-CHX treatment. D) Ubiquitination assay of 293T cells cotransfected with GFP-SNX9, FLAG-RAB40C, and HA-Ub. Upon MG132 treatment, increased polyubiquitination of SNX9 is evident through immunoprecipitation (IP:GFP) and immunoblotting with HA antibody (IB:HA). Input samples for GFP and FLAG serve as controls
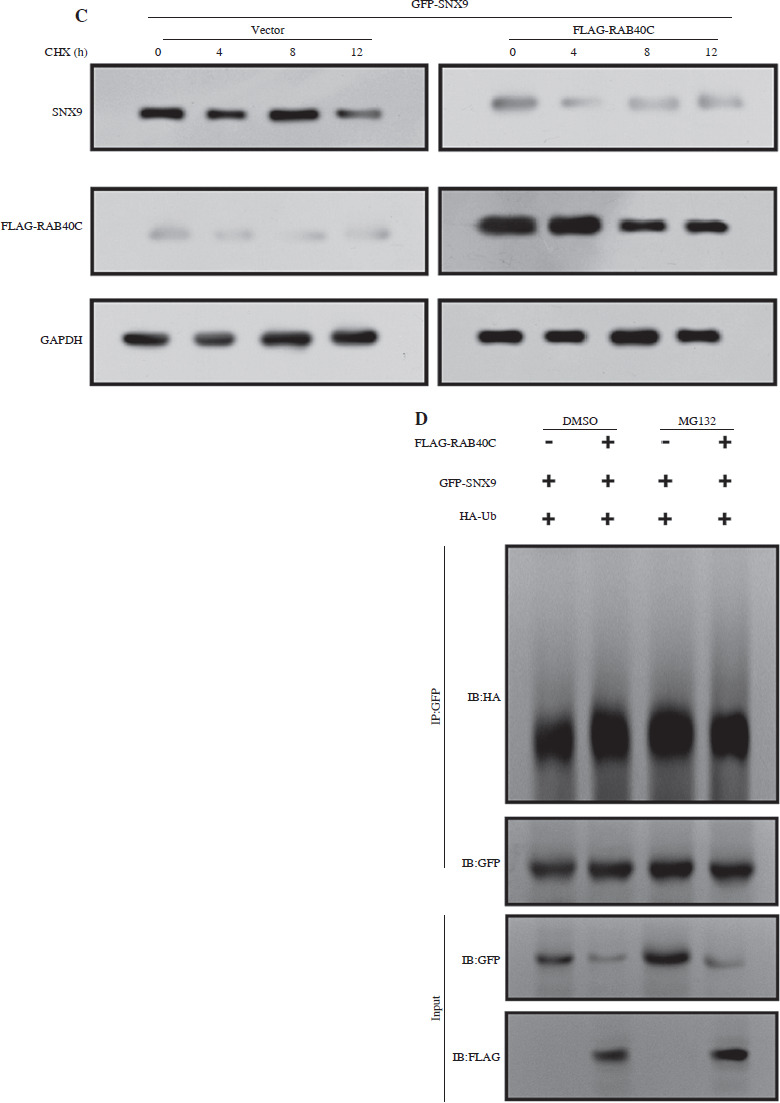
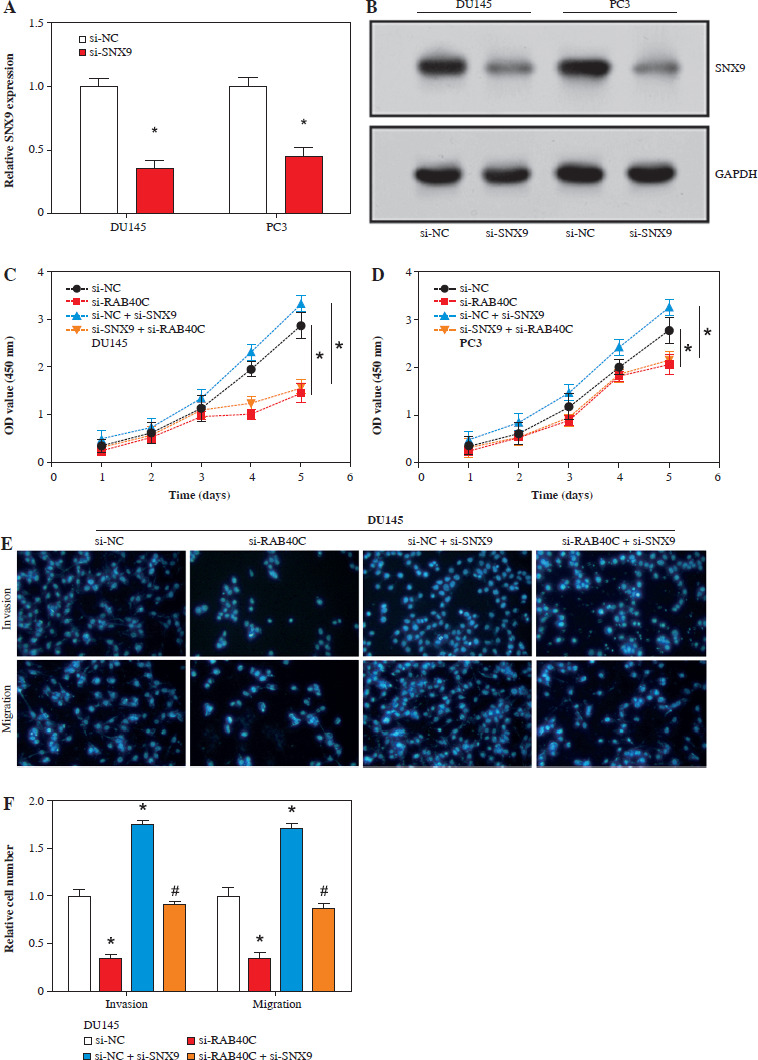
RAB40C promotes tumor growth, invasion, and migration via SNX9
Both qRT-PCR and WB analyses revealed a significant reduction in SNX9 levels in PRAD cells following knockdown (Fig. 6A, B). CCK-8 assays highlighted that after silencing RAB40C, there was a decline in cellular proliferative capacity. However, the reduced expression of SNX9 yielded an opposite effect. After the combined knockdown of RAB40C and SNX9, reduced cell proliferation was observed compared with the control group (Fig. 6C, D). Migration and invasion assays, as depicted in Figure 6E-H, underscored the intricate interplay between RAB40C and SNX9. Migration and invasion were significantly reduced as a result of RAB40C silencing. In contrast, the suppression of SNX9 amplified these cellular behaviors. Notably, inhibiting SNX9 following the silencing of RAB40C partially restored the migration and invasion abilities, albeit not to control levels. This implies that SNX9 may inhibit the RAB40C-induced proliferation, migration, and invasion suppression of PRAD cells.
Fig. 6
RAB40C promotes tumor proliferation, migration, and invasion in an SNX9-dependent manner in PRAD cells. A) qRT-PCR analysis of relative expression levels of SNX9 upon knockdown in DU145 and PC3 cell lines. B) WB detection of SNX9 protein levels in DU145 and PC3 cells after respective knockdown treatments. C, D) CCK-8 detects the effect of knockdown of RAB40C and SNX9 on cell proliferation activity. E-H) Transwell detects the regulation of migration and invasion abilities of DU145 and PC3 cells after RAB40C and SNX9 knockdown. *p < 0.05, #p < 0.05 G, H) Transwell detects the regulation of migration and invasion abilities of DU145 and PC3 cells after RAB40C and SNX9 knockdown. *p < 0.05, #p < 0.05
Interaction between RAB40C and SNX9 regulates Hippo pathway target proteins in PRAD cell lines
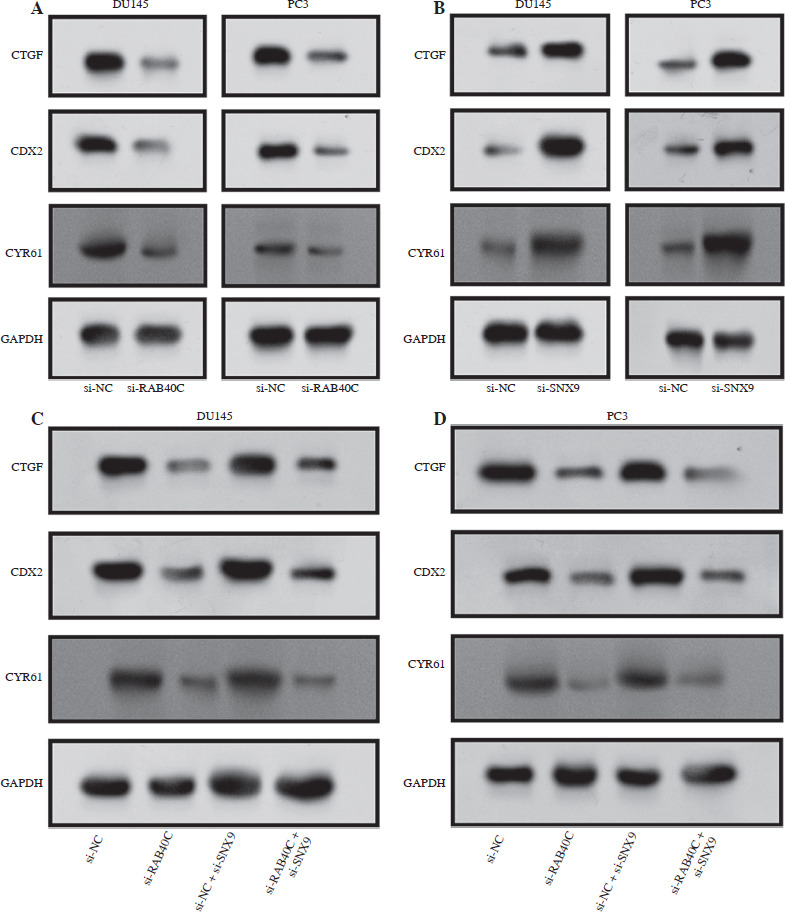
The connection between RAB40C and SNX9 in relation to the target proteins of the Hippo signaling pathway was clarified by the findings from protein level analysis. In the DU145 and PC3 cell lines, RAB40C knockdown demonstrated a substantial decrease in the levels of CTGF, CDX2, and CYR61 (Fig. 7A). A potential inhibitory effect for SNX9 on these Hippo pathway targets is suggested by the fact that SNX9 knockdown in these cell lines resulted in a clear rise in the levels of these proteins (Fig. 7B). Furthermore, combined knockdown of RAB40C and SNX9 in the PRAD cell lines demonstrated a consistent reduction in these proteins, mirroring the effects seen with RAB40C knockdown alone (Fig. 7C, D). These collective data underscore the complex interdependencies of RAB40C and SNX9 in regulating the Hippo signaling pathway targets in PRAD cells.
Fig. 7
Interaction of RAB40C and SNX9 modulates Hippo signaling pathway target proteins in PRAD cell lines. A) WB analysis displaying protein levels of CTGF, CDX2, and CYR61 in DU145 and PC3 cell lines following RAB40C knockdown. B) Protein levels of CTGF, CDX2, and CYR61 in DU145 and PC3 cell lines after SNX9 knockdown, depicted via WB. C) Representation of CTGF, CDX2, and CYR61 protein levels in DU145 cells after combined RAB40C and SNX9 knockdown, illustrated using WB. D) WB analysis of CTGF, CDX2, and CYR61 protein expressions in PC3 cells following combined knockdown of RAB40C and SNX9
Discussion
The three mainstays of diagnosing PRAD have traditionally been prostate-specific antigen (PSA) screening, digital rectal examination, and histological investigation [18-20]. However, their limitations, particularly the suboptimal specificity of PSA, often result in unnecessary biopsies and, in some cases, overtreatment [21-23]. Given the inherent heterogeneity of PRAD, there is a pressing need for a more comprehensive diagnostic approach integrating genetic and molecular markers. This would refine disease classification and more accurately predict treatment responses. Recent advances in targeted gene therapy, especially those addressing the androgen receptor signaling pathway and tumor suppressor genes, offer encouraging results. Notably, both preclinical and clinical settings have witnessed their potential [24]. However, the therapeutic landscape for PRAD still grapples with a lack of precision, often leading to unintended side effects and subpar efficacy. Alarmingly, despite these scientific strides, the five-year survival rate for advanced PRAD remains discouragingly low [25, 26]. This underscores the urgent need for reliable prognostic biomarkers that can better inform treatment decisions, thereby enhancing patient outcomes.
This study performed a comprehensive analysis of gene co-expression signatures in PRAD by WGCNA, which was able to identify distinct gene modules and their association with PRAD. In particular, the MEblue module showed a significant positive correlation with PRAD, suggesting its potential as a biomarker or key contributor to the disease. Then, in order to understand the biological procedures, cellular elements, molecular activities, and pathways related to PRAD, functional enrichment analysis of the MEblue module was carried out. The progression of prostate cancer is linked to the IL-6 signaling system, according to studies by Schroeder et al. [27]. Prostate adenocarcinoma expresses gastrin-releasing peptide receptors, as reported by Qiao et al. [28]. The addition of PPI network analysis further elucidated the complex interactions within the modules, emphasizing the complexity of molecular dynamics in PRAD. Furthermore, our analysis produced prognostic insights by identifying key gene expression patterns. Differences in expression of the selected 15 genes were scrutinized, and 9 of them showed significant variation in PRAD. By applying LASSO regression, a prognostic risk model was established, and three genes, namely PGM5, RAB40C, and MARK2, became prominent contributors to the model. The developed model demonstrated robust performance in predicting patient survival with high concordance index values, confirming its potential clinical utility. The discovery of RAB40C as a key gene with high prognostic importance in PRAD is at the heart of our findings. Its significance in predicting patient outcomes was validated by univariate and multivariate Cox regression analysis. The generated predictive model demonstrated the predictive power of RAB40C, further emphasizing its role as a PRAD hub gene. All of these results highlight the potential clinical importance of RAB40C as a biomarker and treatment target for PRAD.
RAB40C, a protein implicated in the ubiquitination process, appears to play diverse roles across various cellular contexts [29]. As highlighted by recent studies, RAB40C functions as an E3 ligase, a pivotal player in the ubiquitination of RACK1 [30]. In the context of cancer cell development and T cell migration, this function of RAB40C is particularly important [29, 30]. Furthermore, with migrating MDA-MB-231 cells, the role of Rab40c becomes more complicated [31, 32]. Through its E3 ligase complex Rab40c/CRL5, it ubiquitylates ANKRD28, which is a subunit of the PP6 complex. This activity ultimately modulates FAK and Hippo signaling pathway, influencing the dynamics of focal adhesions, which are essential for cell migration and adhesion [31]. Additionally, another layer of complexity emerges in gastric cancer, where RAB40C is directly regulated by let-7a miRNA [33]. This regulation highlights the critical role of RAB40C in gastric tumorigenesis and positions it as a potential target for diagnostic and therapeutic intervention in gastric cancer. In our own research, we observed heightened RAB40C expression in PRAD cells, with especially pronounced expression in the DU145 and PC3 lines. Intriguingly, after silencing RAB40C, we witnessed marked reductions in cell proliferation, accompanied by significant alterations in the cell cycle, and the suppressed migration as well as invasion capabilities of these cells. Our findings highlight the centrality of RAB40C in malignancy and progression of PRAD cells and strongly suggest its viability as a therapeutic target to alter the disease trajectory. Thus, taken together, the multifaceted roles of RAB40C, from ubiquitination to signal modulation, are crucial to our understanding of cell biology, with implications ranging from cellular migration to cancer progression.
The intricate molecular landscape of PRAD offers diverse candidates for understanding disease progression and identifying novel therapeutic targets. SNX9 was initially identified as a facilitator of clathrin-mediated endocytosis, but its role has since evolved. Recent research portrays SNX9 as a versatile scaffold coordinating membrane trafficking with actin dynamics, impacting various cellular functions [34, 35]. Its involvement in clathrin-independent endocytic routes, cell invasion, and division suggests a broader cellular influence [36, 37]. Notably, the literature from Trefny MP points to the contribution of SNX9 to T cell exhaustion, suggesting its potential relevance in cancer progression and therapeutic intervention [38]. The multifaceted nature of SNX9 underscores its significance in cellular processes and disease dynamics. However, our own results add nuance to the understanding of the role of SNX9 in PRAD. Central to our findings is the intricate relationship between SNX9 and RAB40C. Following the silencing of RAB40C, there was notable upregulation of SNX9 expression in PRAD cells, suggesting an inverse regulatory dynamic between the two. The mechanistic underpinning of this interaction was elucidated through experiments that revealed that RAB40C might regulate the stability of SNX9, predominantly through the ubiquitin-proteasome pathway. Further strengthening this association, our experiments demonstrated a direct interaction between FLAG-RAB40C and GFP-SNX9 when overexpressed in 293T cells. Functionally, this inverse relationship has profound implications for PRAD cell behavior. RAB40C-driven proliferation, migration, and invasion appear to be counteracted by SNX9, suggesting that SNX9 might act as a molecular brake, moderating the aggressive cellular behaviors promoted by RAB40C. In essence, our findings illuminate a complex interplay where SNX9 and RAB40C operate in a delicate balance, with implications for PRAD progression and potential therapeutic interventions.
By affecting cell proliferation and apoptosis, the Hippo signaling system, which was first discovered in Drosophila, plays a crucial role in controlling organ size and tissue homeostasis [39]. Its deregulation has been implicated in numerous cancers, as it can promote cell growth, evade apoptosis, and facilitate metastasis [40]. Particularly in PRAD, Hippo pathway dysfunction has been associated with increased tumor aggressiveness, indicating its significant influence on disease progression [41]. For instance, aberrant activation of downstream Hippo targets, such as YAP and TAZ, has been documented in advanced PRAD stages, promoting cancer stem cell characteristics and therapeutic resistance [41, 42]. Our data show that both RAB40C and SNX9 are instrumental in modulating Hippo pathway target proteins in PRAD cells. In particular, the levels of CTGF, CDX2, and CYR61 significantly decreased with RAB40C knockdown, but the expression of these proteins was significantly increased upon SNX9 knockdown. These opposite effects suggest an intricate balance and regulatory mechanism between RAB40C and SNX9 in modulating Hippo pathway activity. Moreover, the simultaneous knockdown of RAB40C and SNX9 showed a similar pattern to RAB40C suppression alone, underscoring the dominant role of RAB40C in this context. In light of our findings, it is evident that the interplay between RAB40C and SNX9 critically influences the Hippo pathway in PRAD, potentially steering disease progression and the therapeutic response.
In conclusion, our comprehensive analysis has shown the crucial function of RAB40C in the development of PRAD, particularly its complex interaction with SNX9. Notably, RAB40C appears to inversely regulate SNX9 levels through a ubiquitin-proteasome-dependent mechanism, underlining its potential as a modulator of protein stability. Moreover, their interaction has a profound influence on the Hippo signaling pathway, with evident alterations in the levels of associated target proteins. This deepened understanding of RAB40C and SNX9, along with their connection to ubiquitination and the Hippo pathway, offers promising avenues for therapeutic strategies in PRAD management.