Introduction
Sepsis-associated encephalopathy (SAE) is a severe complication of sepsis. The most common symptoms of SAE include delirium, coma, and subsequent long-term cognitive dysfunction [1]. Although strategies specifically targeting SAE are lacking, current approaches primarily focus on the use of antibiotics and other supportive care measures to manage sepsis [2]. The pathophysiology of SAE is complex and primarily involves neurotransmitter dysfunction, microglial activation, blood-brain barrier impairment, and severe inflammation- or ischemia-induced brain lesions [3]. As resident macrophages in the brain, microglia can polarize into M1 or M2 phenotypes, which play crucial roles in either immune defense or tissue repair, and microglial polarization exerts a vital effect on SAE pathogenesis [4]. M1 microglia exert proinflammatory effects, contributing to brain tissue injury during the progression of SAE [5]. Therefore, regulating microglial M1 polarization may be a potential approach for SAE treatment; however, the detailed mechanism remains elusive. Therefore, there is an urgent need to explore the mechanism of microglial polarization and select relevant cellular targets for SAE.
The nuclear factor κB (NF-κB) pathway is a classic proinflammatory signaling pathway. The NF-κB family is activated and implicated in deteriorative neuroinflammatory injury in the LPS-stimulated SAE animal model [6]. Additionally, the Toll-like receptor 4 (TLR4)/NF-κB signaling pathway is a well-established mechanism that promotes microglial M1 polarization [7]. P65 is a crucial transcription factor within the NF-κB family. Upon activation of the NF-κB family by lipopolysaccharides (LPS) or other proinflammatory stimuli, the p65/p50 complex is translocated to the nucleus, where it undergoes phosphorylation and initiates the transcription of numerous target genes, including proinflammatory factors and chemokines [8]. Also, p65 nuclear translocation and phosphorylation have been observed in various LPS-induced SAE mouse models [9, 10]. In terms of its role in microglia polarization, the silenced p65 has been shown to down-regulate the proportion of M1 polarized microglia while promoting M2 polarization, which represents an anti-inflammatory phenotype of microglia in mice [11]. The detailed function and mechanism of action of LPS-stimulated human microglial cells are still incomplete and warrant further investigation.
N6-methyl adenosine (m6A) methylation is frequently observed as an epitope modification. It plays a significant role in the regulation of various RNA metabolic processes, including RNA splicing, transcription, and translation, during normal biological functions and disease progression [12]. The m6A methylation mechanism comprises three parts: methyltransferases (writers, including METTL3/14, m6A modification), demethylases (erasers, such as FTO, de-modification), and binding proteins (readers, including YTHDF1/2/3, recognition) [13]. METTL3 is an important initiator of m6A methylation. Furthermore, m6A methylation is involved in sepsis, and increased METTL3 and METTL14 levels have been identified in the macrophages of patients with sepsis [14, 15]. Consistently, upregulated METTL3 expression has been observed in SAE patients with SAE compared to the non-SAE group [16]. However, few studies have explored the role of METTL3 in microglial polarization in SAE. Based on predictions from the JASPAR database (http://jaspar.genereg.net/), we identified a potential binding site for p65 in the promoter region of METTL3. Whether p65 can activate METTL3 to facilitate the polarization of microglia toward the M1 phenotype in SAE warrants further investigation.
High-mobility group box 1 (HMGB1) belongs to a conserved and ubiquitous protein family and is an important mediator of innate inflammation. HMGB1 plays a fundamental role in various pathophysiological phenomena, including inflammatory and immune responses, cellular migration, aging, and cell death [17]. HMGB1 expression is abnormally upregulated in patients with sepsis and that repressed HMGB1 can alleviate sepsis-associated organ injury and reduce mortality in septic mice [18]. HMGB1 repression markedly downregulates microglial M1 polarization to reduce neuroinflammatory reactions and improve neuronal recovery in a spinal cord injury (SCI) model [19]. Furthermore, inhibition of HMGB1 suppressed microglial activation, neuroinflammation, and cognitive impairment in an SAE mouse model [20]. Based on the SRAMP prediction database (http://www.cuilab.cn/sramp/), numerous m6A methylation modification locations have been identified within HMGB1, and more importantly, METTL3 has potential binding sites for HMGB1. Hence, HMGB1 was selected as a target for controlling SAE progression. It is hypothesized that METTL3 may influence the m6A methylation of HMGB1, thereby affecting the polarization of M1 microglia in SAE, which needs to be validated to reveal the cellular mechanisms of SAE.
Therefore, we speculated that p65 enhances microglial M1 polarization by promoting METTL3-mediated m6A methylation of HMGB1 in LPS-stimulated microglia. Elucidating the mechanism by which p65 regulates microglial polarization may provide a potential clinical therapeutic target for SAE. The p65/METTL3/HMGB1 axis can be used for early diagnosis, SAE disease screening, or intervention.
Material and methods
Cell culture
Human microglial HMC3 cells were obtained from the American Type Culture Collection (Manassas, VA, USA) and maintained in Dulbecco’s modified Eagle’s medium (DMEM, Gibco, Indianapolis, IN, USA) with fetal bovine serum (FBS, 10%) and 1% penicillin/streptomycin (Cytiva, Shanghai, China). Cells were cultivated under humidified incubator conditions, at 37°C and with 5% CO2. To establish the SAE in vitro cellular model, HMC3 cells were stimulated with LPS (1 µg/ml, Beyotime Biotech, Shanghai, China) for 24 h, keeping in line with the previous experimental protocols [21]. Additionally, for inhibition of p65, JSH-23 (10 µM, #53852ES05, Yeasen Biotech, Shanghai, China) was employed for incubating cells (48 h).
Cell transfection
To silence METTL3 or HMGB1, the specific short hairpin RNAs (sh-METTL3 or sh-HMGB1) and a control (sh-NC) were custom-designed and acquired from GeneChem (Shanghai, China). The sequences of sh- METTL3 or sh-HMGB1 are as follows: sh-METTL3: 5’-GCCTTAACATTGCCCACTGAT-3’; sh-HMGB1: 5’-CCGTTATGAAAGAGAAATGAA-3’. To overexpress p65 or METTL3, the complete cDNA of p65 or METTL3 was cloned into the pcDNA3.1, vector (Invitrogen, Carlsbad, CA, USA) to generate the pcDNA3.1-p65 or pcDNA3.1-METTL3 constructs. Subsequently, Lipofectamine 3000 Transfection Reagent (#L3000008, Invitrogen, Carlsbad, CA, USA) was used to transfect HMC3 cells for 48 h following the manufacturer’s instructions.
Cell viability assays
HMC3 cell viability was examined using a CCK-8 kit (E-CK-A362; Elabscience, Wuhan, China). In brief, cells (1 × 10⁴ cells/well) were maintained in 96-well plates for 24 h, at 37oC. Next, 10 µl of CCK-8 solution was added to the wells, followed by a 2 h incubation period. Following incubation, the absorbance at 450 nm was measured using a microplate reader from Shanpu Biotech (Shanghai, China).
Enzyme-linked immunosorbent assay (ELISA)
Concentrations of inflammatory cytokines, such as tumor necrosis factor α (TNF-α, #DTA00D), interleukin 1β (IL-1β, #DLB50), and IL-6 (#D6050), were assessed using ELISA kits from R&D Systems located in Minneapolis, MN, USA. The experimental protocol followed the manufacturer’s instructions. Finally, absorbance was measured at 450 nm using a microplate reader (Shanpu Biotech).
Flow cytometry analysis
Antibodies of M1-polarized microglia, CD11b and CD86 were employed and determined by flow cytometry (BD Biosciences, Shanghai, China). After the specific treatment, HMC3 cells were incubated with fluorochrome-conjugated Abs against surface markers including CD4 Ab (APC, #341115, BD Biosciences), CD11b (V421, #566314, BD Biosciences), and CD86 (PE, #555666, BD Biosciences) at 25oC for 0.5 h. Then, the incubated cells were analyzed on the flow cytometer (FC500 MLP, Beckman Coulter, Shanghai, China). CD11b+CD86+ cells were identified as M1 microglial cells.
Quantitative real-time polymerase chain reaction (qRT-PCR)
Total RNA was isolated from HMC3 cells using a TRNzol Universal Total RNA Extraction Kit (#DP424; Tiangen Biotech, Beijing, China). The Quantscript RT Kit (#KR103, Tiangen) was used to perform reverse transcription of cDNA following the manufacturer’s instructions. Relative mRNA levels were determined using FastFire SYBR Green PreMix (Probe, #FP208, Tiangen) on a Bio-Rad CFX Opus 96 system (Bio-Rad, Hercules, CA, USA). GAPDH was used as the internal control for normalization. Analysis of the data was conducted using the 2ΔΔCT approach. Below are the primer sequences used in this investigation (5’-3’):
p65-F: 5’-AGGCAAGGAATAATGCTGTCCTG-3’,
p65-R: 5’-ATCATTCTCTAGTGTCTGGTTGG-3’;
HMGB1-F: 5’-TATGGCAAAAGCGGACAAGG-3’,
HMGB1-R: 5’-CTTCGCAACATCACCAATGGA-3’;
METTL3-F: 5’-AGCCTTCTGAACCAACAGTCC-3’,
METTL3-R: 5’-CCGACCTCGAGAGCGAAAT-3’;
GAPDH-F: 5’-TGAAGGTCGGTGTGAACGGA- TTTGGC-3’,
GAPDH-R: 5’-CATGTAGGCCATGAGGTCCACCAC-3’.
Methylated RIP-qPCR (MeRIP-qPCR)
MeRIP-qPCR was used to analyze the HMGB1’s m6A-modified levels. Briefly, the HMC3 cells were transfected with either sh-METTL3 or sh-NC. Total RNA was isolated using a TRNzol Universal Total RNA Extraction Kit (Tiangen Biotech). Overall, 100 µg of extracted RNA underwent incubation with 3 µg of magnetic beads coated with anti-m6A antibodies (#68055-1-Ig; Proteintech, Rosemont, IL, USA) for 1 h. This process was performed using the immunoprecipitation buffer provided in the kit, which contained RNase and protease inhibitors. Subsequently, RNA was separated from the mixture by centrifugation and further purified using a phenol-chloroform solution. The resulting RNA was eluted using an elution buffer. Finally, qRT-PCR was performed to assess the relative expression of HMGB1.
Western blot analysis
The total protein content of HMC3 cells was extracted by applying the Total Protein Extraction Kit (#PP3001; Aidlab Biotech, Beijing, China). Protein concentration was determined using the BCA Protein Assay Kit (#PC0020; Solarbio Biotech, Beijing, China). Samples of protein were separated using gels for 15% sodium dodecyl sulfate-polyacrylamide gel electrophoresis and then moved to polyvinylidene difluoride (PVDF) membranes (Millipore, Billerica, MA, USA) at 4°C. The PVDF membranes were placed in a solution of 5% BSA (#A600332, Sangon, Shanghai, China) for 1 h at 25°C. Following that, the membranes were subjected to incubation with primary antibodies for 12 h at 4°C. To further incubate the membranes, for 1 h at 25°C, secondary antibodies that were tagged with horseradish peroxidase were employed. The luminescent signals of the protein bands were captured and analyzed using a low background luminescence ECL detection kit (#SNM425, Biolab Biotech, Beijing, China), Azure300 Image system (Azure Biosystems, Dublin, CA, USA), and ImageJ software. Primary antibodies against iNOS (1 : 1000, #13120; CST, Beverly, MA, USA), p65 (1 : 1000, #8242), and p-p65 (1 : 1000, #3033) were acquired from CST. Antibodies against METTL3 (1 : 1000, #67733-1-Ig), HMGB1 (1 : 1000, #66525-1-Ig), and GAPDH (1 : 500, #60004-1-Ig) were purchased from Proteintech.
RNA decay assay
HMC3 cells were incubated with Actinomycin D (5 µg/ml, #A606804, Sangon Biotech, Shanghai) for 3, 6, 9, and 12 h. Next, the cells were collected and RNA was extracted, followed by qRT-PCR analysis to determine the HMGB1 mRNA level.
Luciferase reporter gene assay
The binding sites of p65 on METTL3 (METTL3-WT) and its mutated counterpart (METTL3-MUT) were designed and inserted into the firefly luciferase gene in a psiCHECK2 vector (Promega, Madison, WI, USA). HMC3 cells were grown for 12 h and then co-transfected with either the METTL3-WT or METTL3-MUT reporter gene plasmid, along with either p65 or a control. Following a 48-h incubation period, the dual-luciferase reporter assay system (Promega) was used to evaluate the activities of firefly and Renilla luciferase.
Chromatin immunoprecipitation (ChIP) assay
According to the kit’s experimental guidelines, a high-sensitivity chIP lit (#ab185913, Abcam) was used to conduct the ChIP assay in HMC3 cells. Briefly, 1 × 10⁶ HMC3 cells were fixed with formaldehyde (1%) and collected to resuspend in a lysis buffer (500 µl). Afterward, the lysate was sonicated, and the obtained chromatin was immunoprecipitated with anti-IgG (#ab171870, Abcam) and anti-p65 (#ab218533, Abcam). The immunoprecipitated DNA was purified by elution and analyzed by qPCR.
RNA immunoprecipitation (RIP) assay
The interaction between METTL3 protein and HMGB1 mRNA was further verified using the Magna RIP RNA-Binding Protein Immunoprecipitation Kit (#17-700, Millipore) according to the manufacturer’s protocol. Anti-METTL3 (#ab195352; Abcam) and anti-IgG (#171870; Abcam) antibodies were used as received. Finally, the coprecipitated RNAs were extracted and analyzed by qRT-PCR.
Statistical analysis
Statistical analysis of the data was performed using IBM SPSS Statistics software (version 20.0). Student’s t-test was used to compare two groups, whereas one-way ANOVA followed by Tukey’s test was used for comparisons involving multiple groups. The mean values were reported along with the corresponding standard deviations (SD). Each trial was conducted at least three times in separate instances. The experimental findings were considered statistically significant if the p-value was less than 0.05.
Results
p65, METTL3, and HMGB1 increased in LPS-induced HMC3 cells
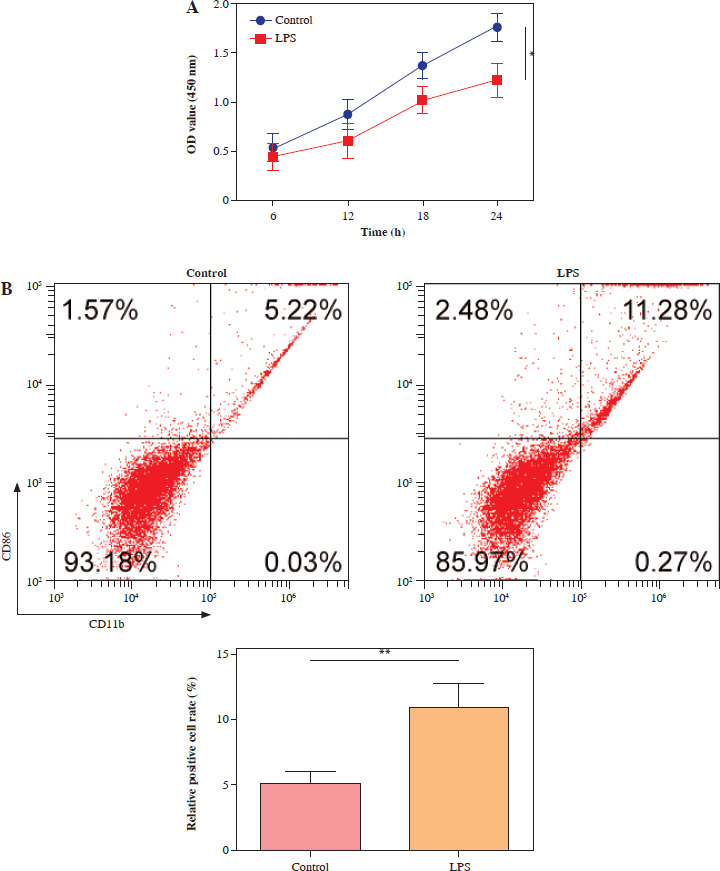
For exploration of the cellular mechanism in SAE, HMC3 cells were stimulated with LPS (1 µg/ml) for 24 h. Compared with the control, the LPS treatment markedly reduced the HMC3 cell viability over time (Fig. 1A). Furthermore, after LPS stimulation, the proportion of CD86+CD11b+ HMC3 cells increased significantly, suggesting that LPS induces M1 polarization in HMC3 cells (Fig. 1B). Consistently, levels of proinflammatory cytokines including TNF-α, IL-1β, and IL-6, were dramatically up-regulated in the LPS group (Fig. 1C). LPS treatment also promoted the expression of iNOS, METTL3, and HMGB1 as well as p65 phosphorylation in microglia (Fig. 1D). Overall, these results indicated that LPS promoted HMC3 cell M1 polarization and increased p-p65, METTL3, and HMGB1 expression in HMC3 cells.
Fig. 1
p65, METTL3, and HMGB1 increased in lipopolysaccharide (LPS)-induced HMC3 cells. HMC3 cells were stimulated with LPS. A) CCK-8 kit was assessed using cell viability. B) The proportion of CD86+CD11b+ cells in HMC3 cells was evaluated using flow cytometry. Data are presented as means ± SD. Significance levels were: *p < 0.05, **p < 0.01, and ***p < 0.001 C) Inflammatory cytokines including TNF-α, IL-1β, and IL-6 were measured by ELISA kits. D) Western blot was performed to detect the levels of iNOS, p-p65, METTL3, and HMGB1. All experiments were performed in triplicate. Data are presented as means ± SD. Significance levels were: *p < 0.05, **p < 0.01, and ***p < 0.001
p65 inhibition attenuated LPS-induced microglia M1 polarization
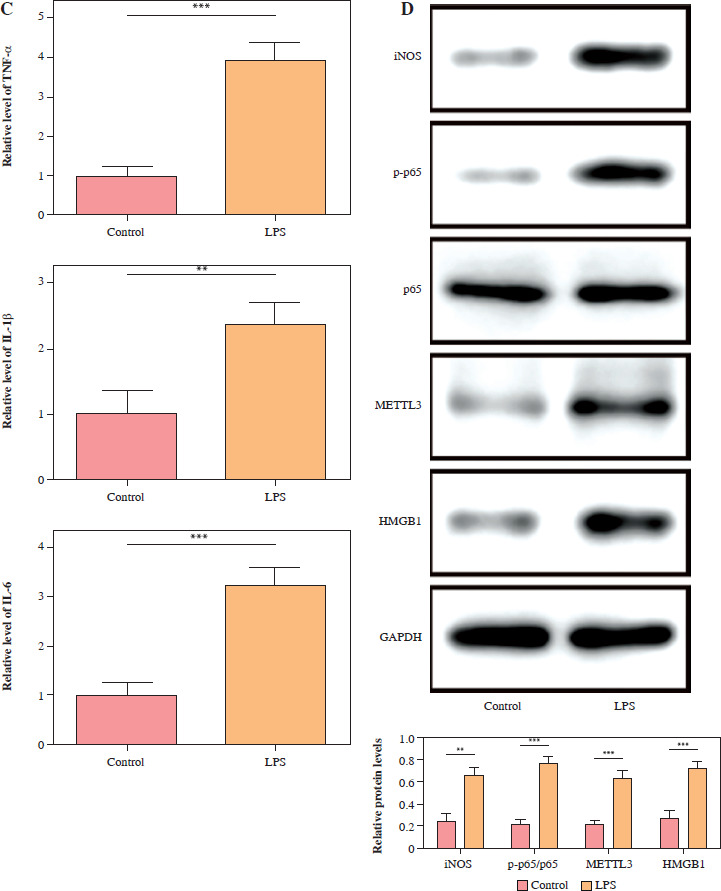
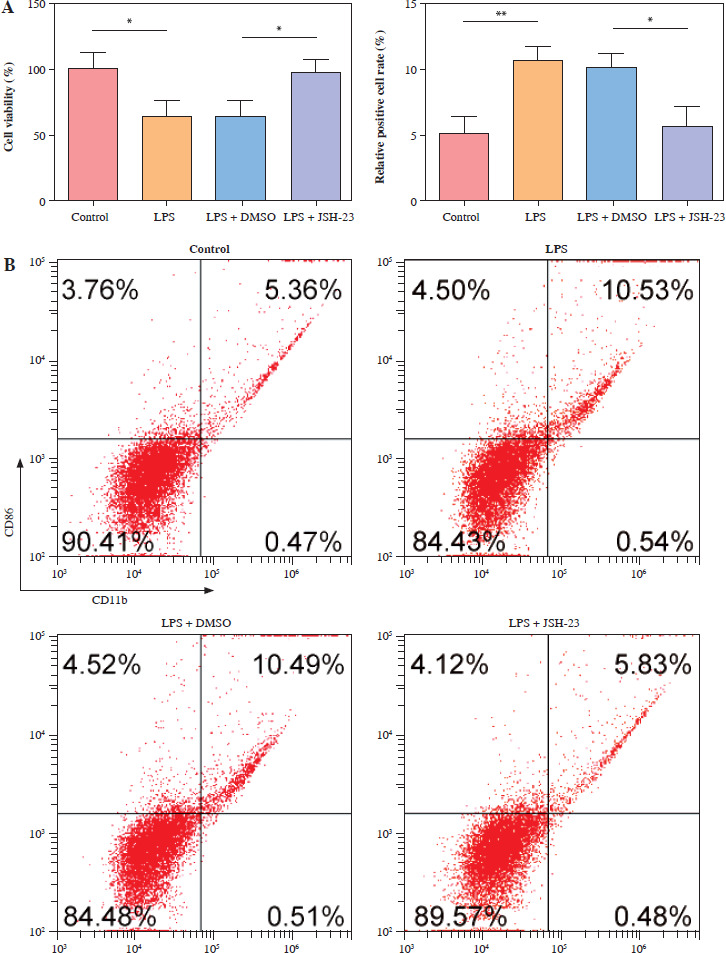
To reveal p65’s function in microglia M1 polarization, the NF-κB signaling inhibitor JSH-23 (10 µM) was used to incubate the HMC3 cells for 48 h and then stimulated with LPS. As shown in Figure 2A, p65 inhibition (JSH-23) significantly increased HMC3 cell viability of HMC3 cells under LPS stimulation. Furthermore, inhibition of p65 reduced the proportion of CD86+CD11b+ cells in LPS-induced HCM3 cells, indicating that inhibition of p65 could prevent the M1 polarization of microglia (Fig. 2B). Similarly, LPS increased the inflammatory cytokine levels (TNF-α, IL-1β, and IL-6) in HMC3 cells, while p65 inhibition reversed this result (Fig. 2C). The expression of iNOS and p-p65 was upregulated in LPS-treated HMC3 cells, and JSH-23 inhibited the phosphorylation of iNOS and p65 (Fig. 2D). Collectively, blocking p65 phosphorylation suppressed LPS-stimulated microglial M1 polarization in HMC3 cells.
Fig. 2
p65 inhibition attenuated lipopolysaccharide (LPS)-induced microglia M1 polarization. HMC3 cells were treated with JSH-23 or LPS. A) Cell viability was assessed using CCK-8 kit. B) Flow cytometry was used to evaluate the proportion of CD86+CD11b+ cells among HMC3 cells. Data are presented as means ± SD. Significance levels were: *p < 0.05, **p < 0.01, and ***p < 0.001 C) Inflammatory cytokine levels were measured using ELISA. D) Western blot was performed to detect iNOS and p-p65 expression. All experiments were performed in triplicate. Data are presented as means ± SD. Significance levels were: *p < 0.05, **p < 0.01, and ***p < 0.001
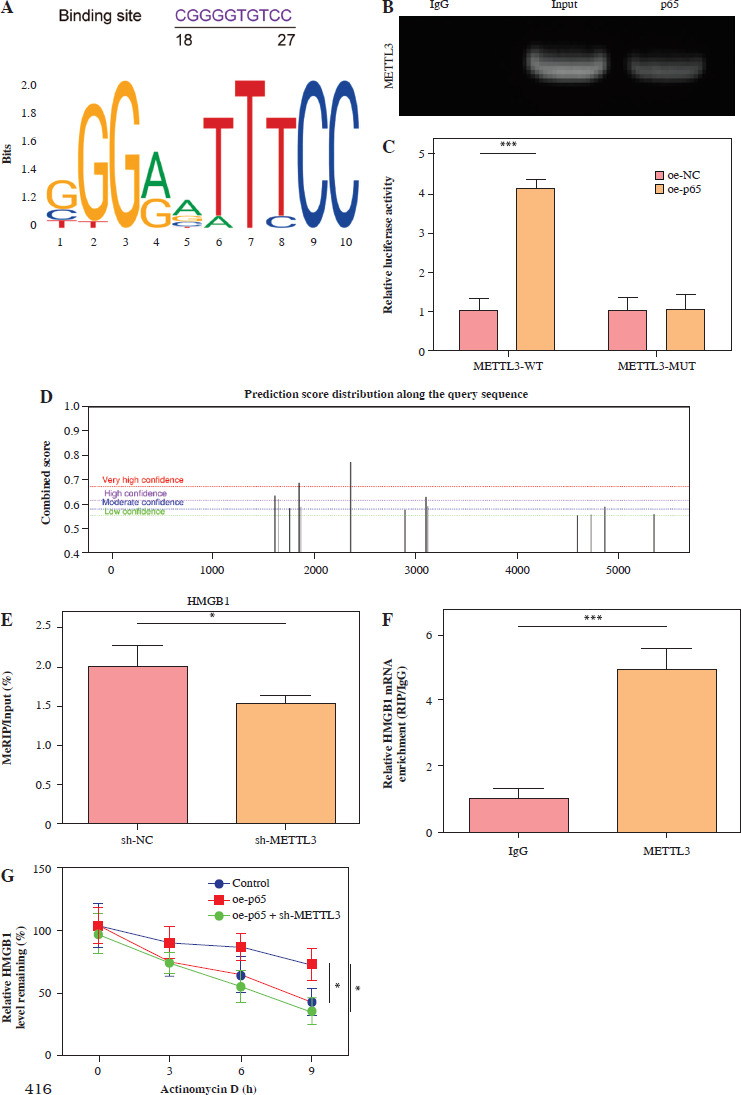
p65 transcriptionally activated METTL3 and facilitated m6A methylation of HMGB1
As shown in Figure 3A, there was a potential binding site for p65 in the METTL3 promoter region, which was revealed in the prediction from the JASPAR database. ChIP analysis also verified the interaction between p65 and the promoter region of METTL3. There was a notable increase in METTL3 expression in the anti-p65 group compared to that in the anti-IgG group (Fig. 3B). Consistently, luciferase activity was increased by oe-p65 transfection in the METTL3-WT group, whereas there was no obvious change in the METTL3-MUT group (Fig. 3C). m6A modification sites in HMGB1 were predicted using the SRAMP database (Fig. 3D). Thereafter, HMC3 cells were transfected with sh-METTL3 and its control vector (sh-NC) to investigate its effects on the m6A methylation of HMGB1. MeRIP-qPCR analysis revealed that the m6A levels in HMGB1 cells were significantly downregulated after METTL3 knockdown (Fig. 3E). RIP analysis confirmed that METTL3 bound to HMGB1 mRNA (Fig. 3F). HMC3 cells were transfected with oe-p65 and/or sh- METTL3. Based on the RNA decay analysis, the RNA stability of HMGB1 was enhanced by p65 overexpression, whereas the result was reversed by METTL3 silencing (Fig. 3G). In summary, our results revealed that p65 positively activates METTL3 to enhance HMGB1 m6A methylation in microglia.
Fig. 3
p65 transcriptionally activated METTL3 and facilitated m6A methylation of HMGB1. A) JASPAR database was used to predict the binding site of p65 in the METTL3 promoter. B, C) ChIP and dual-luciferase reporter assays were employed to verify the relationship between p65 and the METTL3 promoter. D) SRAMP online database predicts the m6A sites of HMGB1. E) MeRIP-qPCR assay was used to determine the m6A methylation levels of HMGB1. F) Interactions between METTL3 and HMGB1 mRNA were analyzed using the RIP assay. HMC3 cells were transfected with sh-METTL3 and/or oe-p65. G) After the cells were treated with Actinomycin D, qRT-PCR was performed to determine the mRNA level of HMGB1. All experiments were conducted in triplicate. Data are expressed as means ± SD, n = 3 per group. *p < 0.05, ***p < 0.001
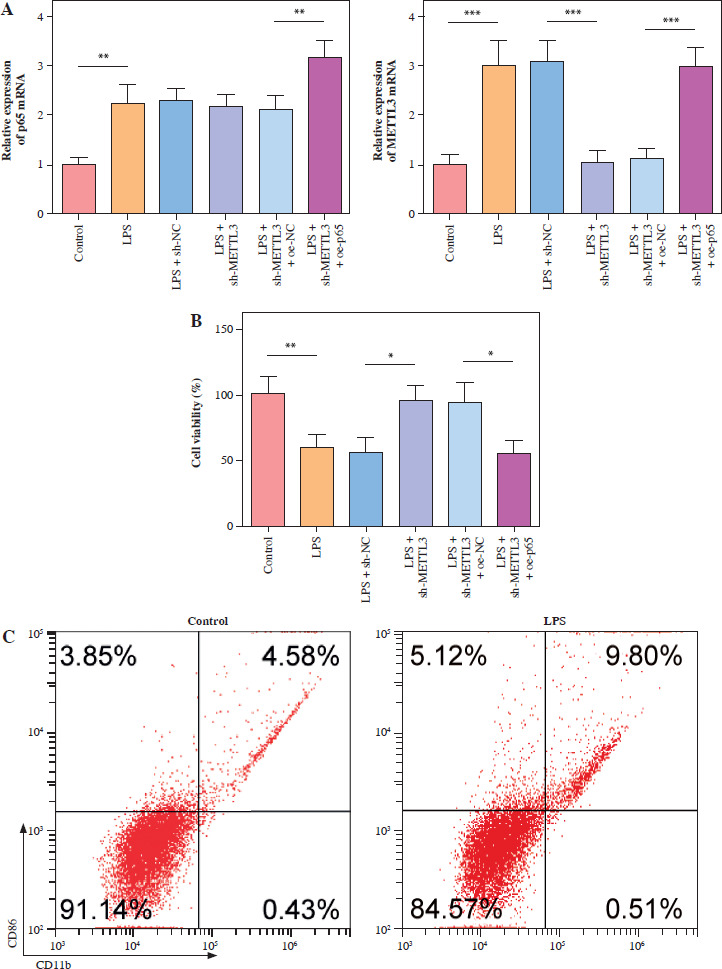
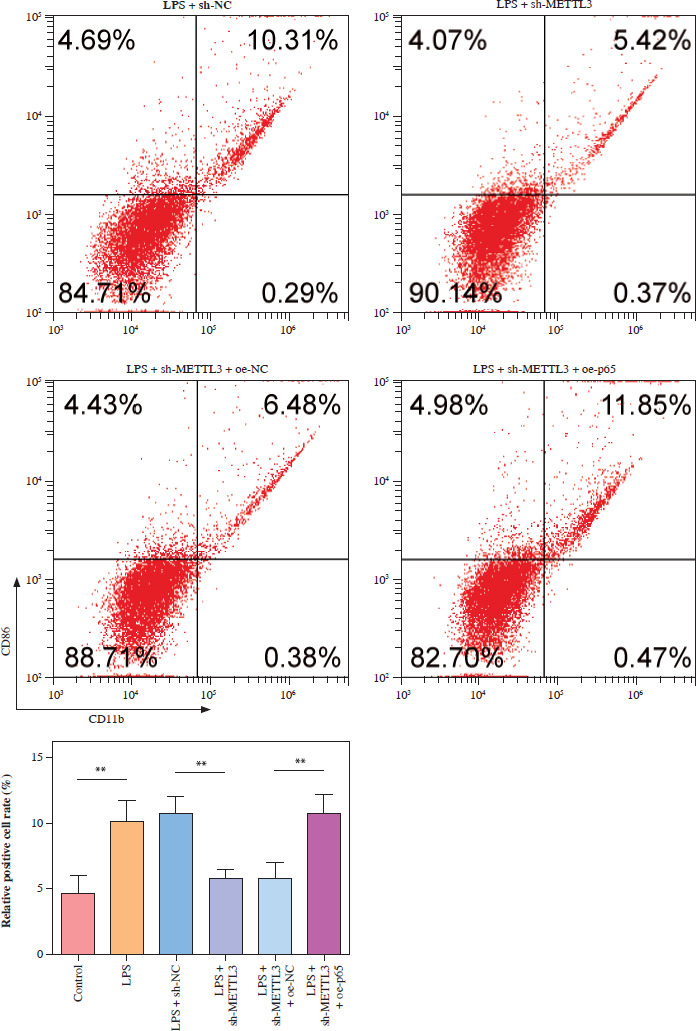
p65 activated METTL3 promoted LPS-induced microglia M1 polarization
HMC3 cells were transfected with sh-METTL3 and/or oe-p65 and treated with LPS. The cells were categorized into the following groups: control, LPS, LPS + sh-NC, LPS + sh-METTL3, LPS + sh-METTL3 + oe-NC, and LPS + sh-METTL3 + oe-p65. As shown in Figure 4A, p65 mRNA abundance was not significantly altered by sh-METTL3 under LPS conditions, whereas p65 expression was further increased by p65 overexpression in LPS-induced HMC3 cells. Additionally, METTL3 silencing downregulated the level of METTL3 under LPS stimulation; however, p65 overexpression significantly relieved the inhibitory effect of sh-METTL3 on METTL3 levels in LPS-induced HMC3 cells. METTL3 silencing increased the viability of LPS-stimulated microglia, whereas p65 overexpression reversed this effect (Fig. 4B). Moreover, silencing of METTL3 repressed the LPS-induced increase in the CD86+CD11b+ proportion in HMC3 cells, whereas overexpression of p65 significantly abolished this trend (Fig. 4C). Similarly, the LPS-induced increase in inflammatory cytokine levels was suppressed by METTL3 downregulation and reversed by p65 overexpression (Fig. 4D). METTL3 inhibition reduced the expression of iNOS and METTL3 in LPS-induced HMC3 cells; p65 overexpression not only alleviated the inhibition of LPS in iNOS and METTL3 levels in HMC3 cells but also promoted p65 and p-p65 (Fig. 4E). Taken together, these results indicate that p65 promotes LPS-stimulated microglial M1 polarization through METTL3 transcription activation.
Fig. 4
p65 activated METTL3 promoted LPS-induced microglia M1 polarization HMC3 cells were transfected with sh-METTL3 and/or oe-p65 and stimulated with LPS. A) qRT-PCR was used to detect the expression of p65 and METTL3. B) A CCK-8 kit was used to assess cell viability. C) Flow cytometry was used to evaluate the proportion of CD86+CD11b+ cells among HMC3 cells. Data are presented as means ± SD. Significance levels were considered as follows: *p < 0.05, **p < 0.01, and ***p < 0.001 C) Flow cytometry was used to evaluate the proportion of CD86+CD11b+ cells among HMC3 cells. Data are presented as means ± SD. Significance levels were considered as follows: *p < 0.05, **p < 0.01, and ***p < 0.001 D) TNF-α, IL-1β, and IL-6 levels were measured by ELISA kits. E) Western blot was performed to detect iNOS, p-p65, and METTL3 expression. All experiments were performed in triplicate. Data are presented as means ± SD. Significance levels were considered as follows: *p < 0.05, **p < 0.01, and ***p < 0.001
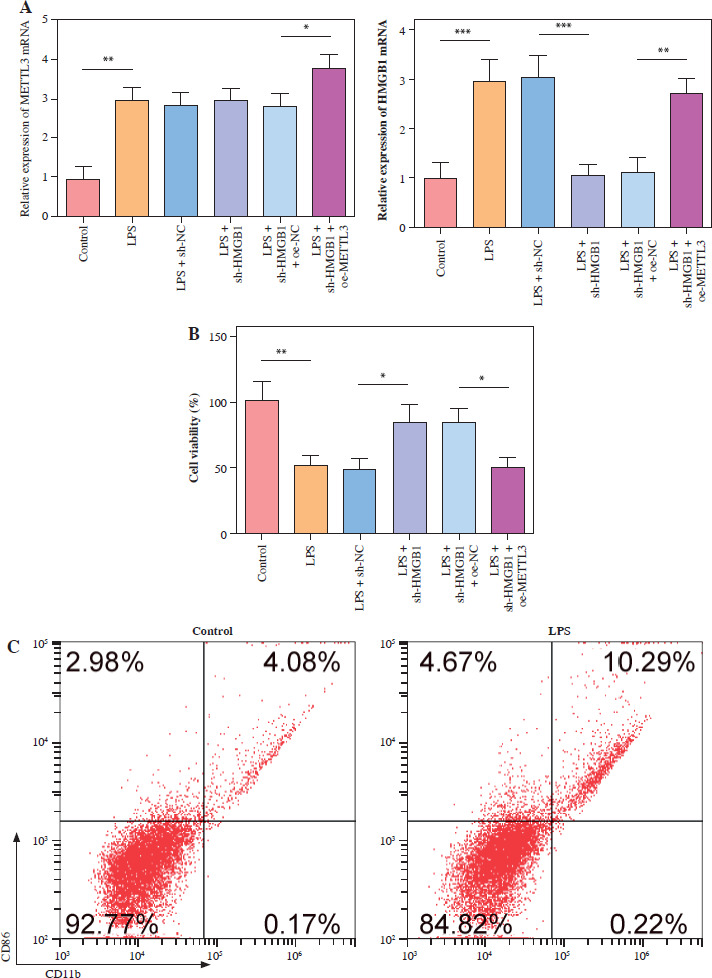
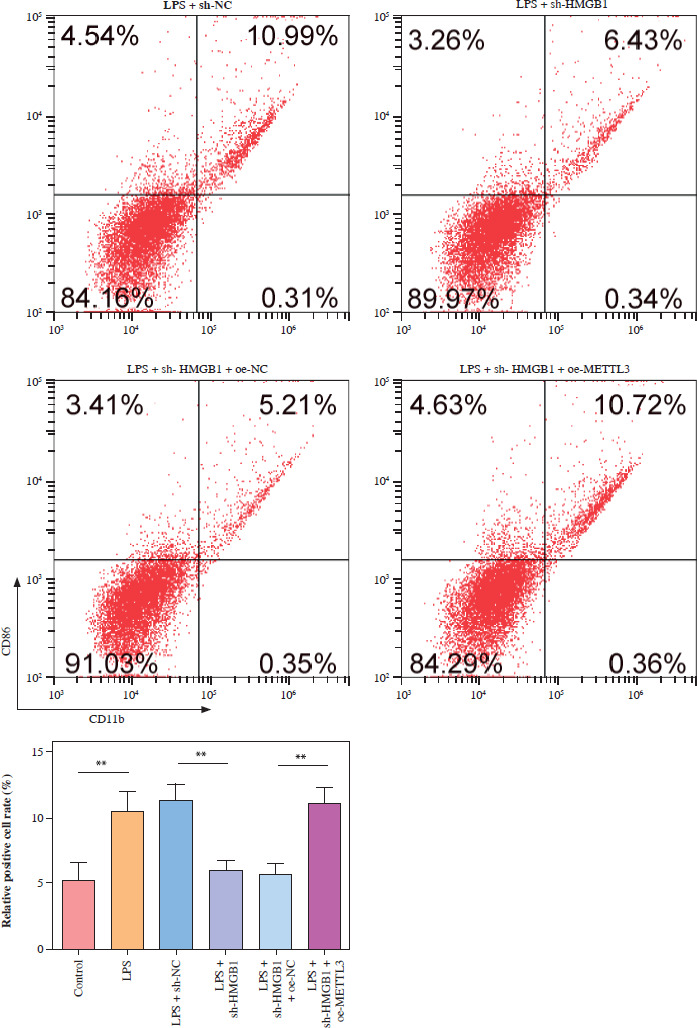
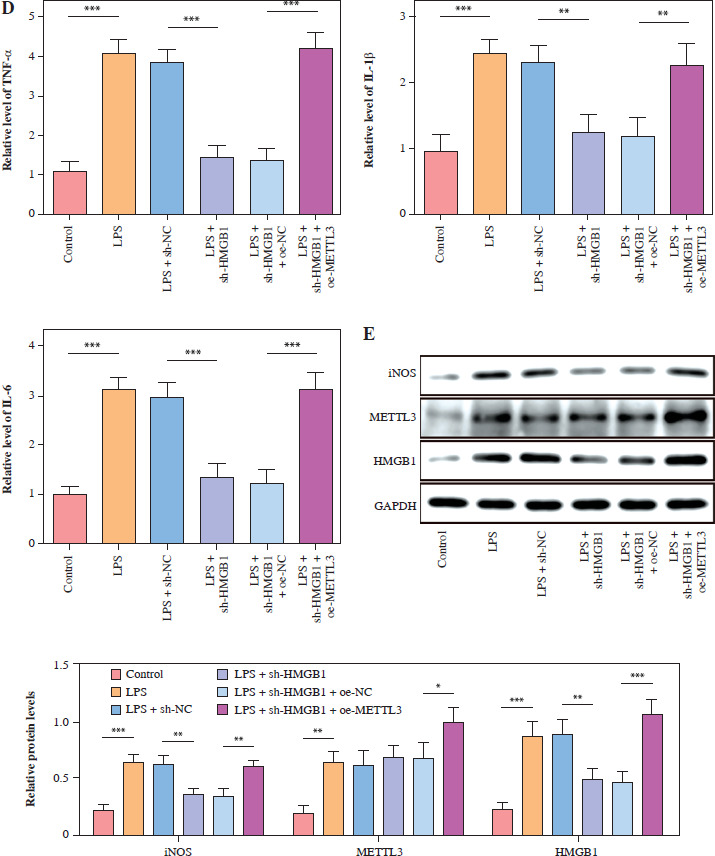
METTL3 up-regulated HMGB1 and enhanced LPS-induced microglia M1 polarization
HMC3 cells were transfected with the HMGB1 and METTL3 overexpression vectors. HMGB1 inhibition significantly downregulated HMGB1 levels in microglia treated with LPS; however, sh-HMGB1 transfection did not affect METTL3 levels. Furthermore, METTL3 overexpression significantly increased the HMGB1 and METTL3 in sh-HMGB1 transfected and LPS-induced HMC3 cells (Fig. 5A). Furthermore, HMGB1 silencing markedly increased the viability of HMC3 cells under LPS conditions, whereas METTL3 overexpression alleviated the effect of HMGB1 silencing on the viability of LPS-stimulated microglia (Fig. 5B). Silencing of HMGB1 significantly repressed LPS-induced microglial M1 polarization, which reduced the proportion of CD86+CD11b+ cells. However, METTL3 overexpression abolished the effects of HMGB1 silencing (Fig. 5C). Consistent with this, the LPS-induced increase in inflammatory cytokine levels was suppressed by HMGB1 downregulation and reversed by METTL3 overexpression (Fig. 5D). Furthermore, iNOS and HMGB1 levels in HMC3 cells were downregulated by HMGB1 knockdown under LPS; however, METTL3 overexpression reversed this trend and increased METTL3 levels in LPS-induced HMC3 cells (Fig. 5E). In conclusion, our data show that METTL3 promotes LPS-stimulated microglial M1 polarization by positively regulating HMGB1 expression.
Fig. 5
METTL3 up-regulated HMGB1 and enhanced LPS-induced microglia M1 polarization. HMC3 cells were transfected with sh-HMGB1 and/or oe-METTL3 and stimulated with LPS. A) qRT-PCR was used to detect the expression of METTL3 and HMGB1. B) A CCK-8 kit was used to assess cell viability. C) Flow cytometry was used to evaluate the proportion of CD86+CD11b+ cells among HMC3 cells. Data are presented as means ± SD. Significance levels were considered as follows: *p < 0.05, **p < 0.01, and ***p < 0.001 C) Flow cytometry was used to evaluate the proportion of CD86+CD11b+ cells among HMC3 cells. Data are presented as means ± SD. Significance levels were considered as follows: *p < 0.05, **p < 0.01, and ***p < 0.001 D) TNF-α, IL-1β, and IL-6 levels were measured by ELISA kits. E) Western blot was performed to detect iNOS, HMGB1, and METTL3 expression. All experiments were performed in triplicate. Data are presented as means ± SD. Significance levels were considered as follows: *p < 0.05, **p < 0.01, and ***p < 0.001
Discussion
Sepsis-associated encephalopathy is a significant complication of sepsis and is characterized by neuroinflammation, neuronal damage, and cognitive impairment [22]. SAE is classified as a neurological syndrome and is associated with acute brain dysfunction or injury [23]. It occurs in ~50% of patients with sepsis, leading to a high mortality rate of 9-76% and a marked decline in the quality of life [24, 25]. Nevertheless, the current treatment options for SAE remain inaccurate and incomplete. Abnormal microglial activation is considered the dominant factor associated with SAE pathogenesis [26]. M1 microglia exert proinflammatory effects and induce neuroinflammatory injury during SAE progression [5]. Microglial M1 polarization was induced by LPS, and the expression of p65, METTL3, and HMGB1 was significantly enhanced. Subsequently, we demonstrated the precise mechanism by which p65 promotes the METTL3-mediated m6A methylation of HMGB1 to aggravate microglial M1 polarization in LPS-induced HMC3 cells. This finding elucidates the regulatory mechanism of M1 polarization in microglia and offers a potential molecular target for SAE-restraining strategies.
NF-κB is an intensively studied transcription factor family involved in inflammatory modulation. p65, an essential component of the NF-κB group, is involved in neuroinflammation in SAE [10]. Regarding microglial regulation, p65 enhances microglial cell migration and neuroinflammatory responses in an SAE-related inflammation model [27]. In this study, LPS stimulation significantly promoted M1 microglial polarization in HMC3 cells, which mirrored the findings of a prior investigation [28]. As for microglial inflammation, amyloid-β (triggering neurotoxicity)-induced inflammation in BV-2 cells is associated with elevated levels of GAPDH, resulting in decreased release of interferon γ (IFN-γ) from the activated inflammatory microglia [29]. This suggests that cellular metabolism changes with survival and normal function during microglial inflammation. In this study, LPS treatment did not affect GAPDH expression in the microglial inflammatory model of HMC3 cells. Our results are consistent with those of a previous study, which observed no effect on GAPDH expression and selected it as the reference gene [30]. The differential expression of GAPDH may be attributed to the different inducers used. Moreover, we found that the level of phosphorylated p65 was markedly upregulated in LPS-stimulated microglia. This finding is supported by experimental evidence of enhanced p65 phosphorylation in an animal model of SAE [9, 10]. We initially found that p65 inhibition suppressed LPS-induced M1 polarization in microglia. This finding is partially consistent with the results of animal studies, which demonstrated that p65 silencing reduced the proportions of M1 polarized microglia while increasing M2 polarization [11]. Collectively, our results revealed that p65 promoted microglial M1 polarization in LPS-induced HMC3 cells, which replenished their potential for the treatment of SAE neuroinflammation.
METTL3 is the primary methyltransferase that forms a heterodimer with METTL14 and combines with other auxiliary proteins to form a methyltransferase complex [31]. Abnormal m6A methylation and altered METTL3 expression have been identified during the progression of sepsis and SAE [15, 32]. Notably, METTL3 expression was significantly elevated in the sera of patients with SAE [16]. In the present study, METTL3 expression was markedly enhanced in LPS-treated HMC3 cells, which promoted microglial activation. This finding is consistent with that of a previous study [33]. Moreover, we verified that p65 transcriptionally activated METTL3 to promote LPS-stimulated microglial M1 polarization. The result is partially consistent with a study showing that NF-κB signaling inhibition represses METTL3-mediated microglial activation [34]. However, our experimental data supplemented the specific role of p65 and its mechanism of METTL3 in the M1 polarization of microglia.
As a well-studied innate immunomodulatory protein, HMGB1 frequently participates in neuroinflammation and microglial activation [35]. HMGB1 levels were significantly elevated in patients with SAE and LPS-treated microglia [36]. Furthermore, we clarified that silencing HMGB1 significantly inhibited M1 polarization and inflammatory responses in LPS-stimulated microglia, which is consistent with various published reports [19, 20, 37]. We first verified that METTL3 can stabilize HMGB1 mRNA through m6A modification and further induce microglial M1 polarization. Controlling m6A methylation of HMGB1 by METTL3 could offer a new approach to address SAE.
In summary, our study demonstrated that p65 promotes microglial M1 polarization by enhancing the METTL3/HMGB1 axis in LPS-induced HMC3 cells. However, the described mechanism still needs to be validated in vivo to offer a deeper exploration. Overall, our study demonstrated that p65 activates METTL3 and promotes HMGB1 m6A modification in microglial M1 polarization, which may be used as an early diagnostic, therapeutic, or drug development target for SAE.