Introduction
In recent years, the outbreak of the COVID-19 pandemic has triggered a global health crisis. This acute respiratory disease, caused by the SARS-CoV-2 virus, has not only severely impacted global health but has also had widespread and profound socioeconomic effects [1, 2]. Although COVID-19 primarily presents with respiratory symptoms, an increasing number of studies have shown that the virus can cause systemic diseases, affecting the cardiovascular, renal, and nervous systems [3, 4]. Notably, there is a strong association between COVID-19 and the occurrence of venous thrombosis. Venous thromboembolism (VTE), which includes deep vein thrombosis (DVT) and pulmonary embolism (PE), is a significant cause of morbidity and mortality worldwide. Among individuals infected with COVID-19, the incidence of venous thrombosis is markedly elevated, exacerbating the severity of the disease and increasing mortality risk [5]. Therefore, investigating the link between COVID-19 and venous thrombosis, as well as its underlying molecular mechanisms, holds critical clinical significance.
The high incidence of venous thrombosis in COVID-19 patients has garnered significant attention from the medical community. Recent studies have highlighted the complex relationship between COVID-19 and venous thrombosis, emphasizing the critical roles of inflammatory responses, coagulation system disruptions, and immune dysregulation in this process. SARS-CoV-2 infection triggers a “cytokine storm”, a severe inflammatory response that not only damages the lungs but also activates vascular endothelial cells, leading to coagulation abnormalities [6, 7]. This mechanism is likely a key factor in the development of venous thrombosis among COVID-19 patients. However, despite initial investigations into the relationship between COVID-19 and venous thrombosis, most studies have been limited to single-pathology analyses or small patient cohorts and have not fully elucidated the shared molecular mechanisms underlying both conditions [8-10]. Therefore, further exploration of the molecular basis linking COVID-19 and venous thrombosis, particularly the identification of common biomarkers and potential therapeutic targets, is crucial for improving clinical diagnosis and treatment outcomes.
With the continuous advancement of high-throughput sequencing technologies and bioinformatics analysis methods, researchers can now investigate the molecular mechanisms of complex diseases at the whole-genome level. In this study, we performed an integrated analysis of multiple public datasets to explore the shared molecular characteristics of COVID-19 and venous thrombosis. Specifically, we downloaded and analyzed several datasets, including GSE171110, GSE189990, GSE178246, GSE48000, and GSE19151. We employed various methods such as differential gene expression analysis, functional enrichment analysis, and protein-protein interaction (PPI) network construction to identify common differentially expressed genes (DEGs) in patients with COVID-19 and venous thrombosis. This comprehensive analysis not only facilitated the identification of key hub genes but also uncovered potential signaling pathways and regulatory networks. Furthermore, through drug sensitivity and immune infiltration analyses, we assessed the clinical applicability of these key genes, thereby offering new possibilities for the precision treatment of both diseases.
Although previous studies have made some progress in exploring the molecular mechanisms underlying COVID-19 and venous thrombosis, they are often limited by their focus on single datasets or specific genes, lacking both comprehensiveness and systematic analysis. In contrast, this study offers an innovative approach by integrating multiple datasets to extract shared molecular insights from extensive gene expression data. Using various bioinformatics tools, we have identified molecular intersections between COVID-19 and venous thrombosis from multiple perspectives. Additionally, by constructing transcription factor (TF)-target gene and miRNA-target gene networks, this study investigated the upstream regulatory mechanisms of these critical genes. This comprehensive approach provides a new perspective for understanding the shared pathological basis of COVID-19 and venous thrombosis, laying a solid foundation for future research.
The primary objective of this study was to systematically reveal the common molecular mechanisms between COVID-19 and venous thrombosis through multi-dataset analysis, identifying key DEGs and regulatory networks. Our analysis successfully identified shared biomarkers for COVID-19 and venous thrombosis, such as the hub genes SELP and CLEC4D. These genes not only exhibit significant differential expression in both diseases but may also play a role in regulating key pathological processes such as immune and inflammatory responses. Furthermore, drug sensitivity analysis indicated that these genes are closely associated with sensitivity to specific chemotherapeutic agents, suggesting their potential as targets for precision therapy. Immunoinfiltration analysis revealed that these genes are significantly upregulated in specific immune cells, further supporting their critical role in disease progression. The findings of this study provide new molecular markers and potential targets for the diagnosis and treatment of COVID-19 and venous thrombosis, offering significant scientific and clinical value.
Material and methods
Data source
The datasets GSE171110, GSE189990, GSE178246, GSE48000, and GSE19151 were downloaded from the Gene Expression Omnibus (GEO) database. The GSE171110 dataset includes transcriptomic data from 10 healthy whole blood samples and 44 COVID-19-infected whole blood samples. The GSE189990 dataset contains transcriptomic data from 4 healthy whole blood samples and 20 COVID-19-infected whole blood samples. The GSE178246 dataset comprises miRNA expression data from 70 healthy whole blood samples and 95 COVID-19-infected whole blood samples. The GSE48000 dataset includes transcriptomic data from 25 healthy whole blood samples and 107 whole blood samples from patients with venous thrombosis. The GSE19151 dataset consists of transcriptomic data from 63 healthy whole blood samples and 70 whole blood samples from patients with venous thrombosis. The clinical characteristics of patients in each dataset are presented in Supplementary Tables 1-3.
The GSE171110 and GSE48000 datasets serve as the core datasets for this study, used to identify differentially expressed genes associated with COVID-19 and venous thrombosis, perform functional enrichment analysis, construct PPI networks, conduct immune infiltration analysis, and perform LASSO regression. The GSE189990 and GSE19151 datasets were employed to validate the expression levels of key genes and construct transcription factor-target gene regulatory networks. The GSE178246 dataset, which focuses on miRNA expression in COVID-19, was used to construct miRNA-target gene regulatory networks.
Establishment of animal model and sample collection
C57 mice weighing 250-300 g (Beijing Vital River Laboratory Animal Technology Co., Ltd., Animal Production License No.: SCXK (Beijing) 2021-0006) were used in this study. After a three-day acclimatization period, the mice were randomly divided into three groups: the control group (n = 5), the sham operation group (n = 5), and the model group (n = 10). The control group received no treatment. In the sham operation group, the inferior vena cava (IVC) and its branches were not ligated, but all other procedures were identical to those performed in the model group. After shaving the abdominal area, the mice were disinfected with iodine tincture and 75% ethanol (Beijing ZONCI Technology Development Co., Ltd.). An incision was made along the abdominal midline, extending from below the xiphoid process to the upper edge of the liver. The small intestine was gently moved to the left side using a moistened cotton swab and covered with gauze soaked in warm saline (Gibco, USA). Under a stereomicroscope (OLYMPUS BX53), the IVC was isolated, and a 7-0 suture was used to tie the IVC together with a 30 G needle. The needle was then removed to complete the ligation. The same method was applied to ligate the branches of the IVC. Postoperatively, 8000 U of penicillin (Harbin Pharmaceutical Group) was administered intraperitoneally to prevent infection, and the abdominal incision was closed in layers with 5-0 sutures.
Hematoxylin and eosin (H&E) staining of tissue samples
Tissue samples were first rinsed under running water for 30 minutes and then dehydrated sequentially in the following ethanol solutions: 75% ethanol (Tianjin Yongda Chemical Reagent Co., Ltd.) overnight, followed by 80%, 85%, 90%, 95%, and 100% ethanol for 30 minutes each. After a second 30-minute soak in 100% ethanol, the samples were immersed in xylene (Shandong Tianli Pharmaceutical Co., Ltd.) for 20 minutes, followed by a second xylene bath for 10 minutes. Subsequently, the samples were embedded in paraffin (Leica) after 30 minutes each in three paraffin baths. The paraffin-embedded samples were then chilled for 2 hours before being sectioned into 4 µm slices using a rotary microtome (HistoCore MULTICUT, Leica). The sections were cleared in three changes of xylene (5 minutes each), rehydrated through a graded ethanol series (100%, 95%, 90%, 85%, 80%, 75%) for 2 minutes each, and then rinsed in distilled water for 5 minutes. The sections were stained with hematoxylin (Beyotime) for 10 minutes, rinsed in running water for 5 minutes, and counterstained with eosin for 2 minutes. After staining, the sections were dehydrated through a graded ethanol series (75%, 80%, 85%, 90%, 95%, 100%) for 20 seconds each, cleared in two changes of xylene (5 minutes each), and mounted using 50 µl of neutral balsam under a coverslip. Air bubbles were removed, and the slides were examined under a microscope (BX53, OLYMPUS).
Immunohistochemical staining
First, paraffin-embedded samples were chilled in a refrigerator for 2 hours. The samples were then preheated using a combination system with settings of 45oC for section spreading, 50oC for section drying, and 95oC for section baking, with each process lasting 30 minutes. Following the instructions of the microtome, the samples were sectioned into 4 µm-thick slices. The sections were then immersed sequentially in xylene I, xylene II, and xylene III for 5 minutes each, followed by two 5-minute immersions in anhydrous ethanol. Next, the sections were immersed for 2 minutes each in 95%, 90%, 85%, 80%, and 75% ethanol, and finally in membrane-breaking solution (270 ml methanol and 30 ml 30% hydrogen peroxide) for 10 minutes. The sections were rinsed with double-distilled water three times, each rinse lasting 5 minutes. Antigen retrieval solution (500 ml double-distilled water and 4.75 ml Antigen Unmasking Solution, VECTOR) was boiled in a microwave, and the sections were placed in the solution at medium-low heat for 2 minutes. After cooling to room temperature, the sections were washed three times with 2% PBST buffer (1000 ml PBS buffer and 2 ml Tween-20, BioFRoxx) for 5 minutes each. Each slide was then covered with 50 µl of 1% BSA blocking solution (1 g BSA dissolved in 100 ml PBS), sealed with cover film, and incubated at room temperature for 30 minutes. Subsequently, 50 µl of diluted primary antibody solution (CASP5, Immunoway, 1 : 200; CLCE4D, Immunoway, 1 : 200; C1QB, Immunoway, 1 : 200; SELP, Immunoway, 1 : 300; Goat Anti-Rabbit IgG Antibody, Millipore, 1 : 200) was added to each slide, sealed with cover film, and incubated overnight at 4oC. The sections were then washed three times in 2% PBST buffer for 5 minutes each. Afterward, 50 µl of diluted secondary antibody solution was added to each slide, sealed with cover film, and incubated at 37oC for 1 hour. The sections were washed three times again with 2% PBST buffer for 5 minutes each, followed by the addition of 50 µl ABC solution (VECTASTAIN Elite ABC Kit, VECTOR) to each slide, which was incubated at room temperature for 30 minutes. After washing three times in 2% PBST buffer for 5 minutes each, 50 µl DAB substrate solution (DAB Substrate Kit, VECTOR) was applied for 2 minutes, and the reaction was stopped with 2% PBST buffer. The sections were counterstained with hematoxylin for 2 minutes, rinsed in running water for 5 minutes, and then sequentially immersed for 2 minutes each in 75%, 80%, 85%, 90%, and 95% ethanol, followed by anhydrous ethanol. Finally, the sections were immersed in xylene II and xylene I for 5 minutes each. Each slide was covered with 50 µl of neutral resin, sealed with a coverslip, and observed under a microscope (BX53, OLYMPUS) after air bubbles were removed.
Quantitative reverse transcription polymerase chain reaction (qRT-PCR) analysis
To validate the expression levels of key genes, quantitative real-time PCR was conducted. Total RNA was first extracted from the samples using Trizol reagent (Invitrogen, USA) following the manufacturer’s protocol. The total RNA was then reverse-transcribed into cDNA using a reverse transcription kit (Takara, Japan). qRT-PCR was performed on an ABI 7500 Real-Time Fluorescence Quantitative PCR System (Applied Biosystems, USA) with SYBR Green PCR Master Mix (Takara, Japan). Each reaction mixture contained 2 µl of cDNA, 10 µl of SYBR Green Master Mix, 1 µl of forward primer, 1 µl of reverse primer, and 6 µl of nuclease-free water, making up a total volume of 20 µl. The cycling conditions were as follows: an initial denaturation at 95oC for 30 seconds, followed by 40 cycles of denaturation at 95oC for 5 seconds, and annealing at 60oC for 30 seconds. The relative gene expression levels were calculated using the 2–ΔΔCt method, with ACTIN serving as the internal control. All experiments were performed in triplicate to ensure the reliability of the results.
Transcriptome differential analysis
Transcriptome datasets were downloaded from the GEO database, specifically GSE171110, GSE189990, GSE178246, GSE48000, and GSE19151. The GSE171110 dataset comprises transcriptomic data from 10 healthy whole blood samples and 44 samples from individuals infected with COVID-19. The GSE189990 dataset includes transcriptomic data from 4 healthy whole blood samples and 20 COVID-19-infected samples. The GSE178246 dataset contains miRNA expression data from 70 healthy whole blood samples and 95 COVID-19-infected samples. The GSE48000 dataset consists of transcriptomic data from 25 healthy whole blood samples and 107 samples from patients with venous thrombosis. The GSE19151 dataset includes transcriptomic data from 63 healthy whole blood samples and 70 samples from patients with venous thrombosis. Differential analysis between groups was performed using the “Limma” package in R (version 4.2.1). Data transformation and normalization were conducted using the voom function to facilitate linear model analysis. Design and contrast matrices were constructed, and model fitting and Bayesian statistics were performed using the lmFit and eBayes functions. Differentially expressed genes were identified based on a corrected p-value < 0.05 and a fold change > 1.5. Heatmaps of differential gene expression were generated using the “heatmap” package in R, volcano plots were created with the “ggplot2” package, and Venn diagrams were plotted using the “vennDiagram” package.
Functional enrichment analysis
Gene Ontology (GO) enrichment analysis is a standard approach in large-scale gene data analysis, encompassing three components: Biological Process (BP), Cellular Component (CC), and Molecular Function (MF). The Kyoto Encyclopedia of Genes and Genomes (KEGG) was used to explore the pathways associated with specific gene sets. Enrichment analysis based on GO and KEGG was conducted using the “ClusterProfiler” package in R version 4.2.1, with significant enrichment defined by a threshold of p < 0.05.
Protein-protein interaction
Protein-protein interactions are crucial for understanding the cellular physiology underlying health and disease. To analyze PPIs, we used the STRING database (https://string-db.org/) with an interaction score threshold of 0.4. The PPI network was then visualized using Cytoscape version 3.9.0. To identify key modules within the PPI network, we applied the Molecular Complex Detection (MCODE) plugin, setting the node score cutoff at 0.2. Further, we ranked the nodes within the PPI network using the CytoHubba plugin to identify the top 15 hub genes. These hub genes were subsequently used to construct a gene-gene interaction network via the GeneMANIA tool, facilitating the evaluation of their functional roles.
Construction of TF-target gene and miRNA-target gene networks
For the construction of the TF-target gene network, we used the TRRUST database (https://www.grnpedia.org/) to identify TFs associated with the target genes, followed by the creation of an interaction network using Cytoscape software (version 3.9.0).
For the miRNA-target gene network, we first predicted miRNAs targeting the genes using the miRDB, Target-Scan, and MiRTarBase databases. The predicted miRNAs were then intersected with the differentially expressed miRNAs from the GSE178246 dataset. The resulting mi-RNAs were identified as regulators of the target genes, and an interaction network was subsequently constructed using Cytoscape software (version 3.9.0).
Drug sensitivity analysis
Chemotherapeutic drugs associated with the expression levels of target sensitivity genes were screened using the CellMiner database. The drug sensitivity of hub genes was evaluated by applying the 50% growth inhibition concentration (GI50), where a lower GI50 indicates higher drug sensitivity.
Least absolute shrinkage and selection operator (LASSO) regression analysis
LASSO regression employs L1 regularization to penalize the features within a model, allowing for the selection of features that have the most significant impact on the target variable. In this study, LASSO regression was conducted using the “glmnet” package in R software to identify disease-associated feature genes.
Immune infiltration analysis
The immune cell type relative abundances in the GSE48000 and GSE171110 datasets were assessed using the CIBERSORT algorithm. Initially, the datasets were downloaded, and the expression data for genes such as SELP, CLEC4D, C1QB, and CASP5 were extracted. Subsequently, the data were processed and analyzed using R software and the CIBERSORT algorithm to evaluate the relative abundances of various immune cell types, including T cells, B cells, and natural killer cells. The differences in immune cell abundances between groups were then compared to elucidate the roles of these genes within the immune environment.
Statistical analysis
For quantitative data, a t-test or U-test was employed to compare differences between the two groups, depending on whether the data followed a normal distribution. Correlation analysis was conducted using the Pearson test. The diagnostic ability of the target genes for the disease was evaluated using the receiver operating characteristic (ROC) curve. All statistical analyses were performed using R software, with statistical significance set at p < 0.05 (significance levels indicated as follows: # for 0.05 < p < 0.2, * for p < 0.05, ** for p < 0.01, *** for p < 0.001).
Results
Shared gene expression differences between COVID-19 and venous thrombosis
To investigate the common molecular mechanisms between COVID-19 and venous thrombosis, we conducted a systematic analysis of DEGs and functional enrichment using multiple publicly available datasets. The analysis revealed that in the peripheral blood of patients with venous thrombosis, compared to healthy controls, a total of 798 genes were differentially expressed, with 745 genes upregulated and 53 genes downregulated (Fig. 1A). Figure 1B illustrates the top 100 most significantly dysregulated genes. In the peripheral blood of COVID-19 patients, 6,589 genes were differentially expressed compared to healthy controls, with 3,090 genes upregulated and 3,499 genes downregulated (Fig. 1C). Figure 1D shows the top 100 most significantly dysregulated genes. Among the DEGs, 90 were commonly dysregulated in both venous thrombosis and COVID-19 patients’ peripheral blood, with 85 genes upregulated and 5 genes downregulated in both conditions (Fig. 1E, F).
Fig. 1
Gene expression analysis in COVID-19 and venous thrombosis patients. A) Volcano plot of DEGs between venous thrombosis patients and normal controls in the GSE48000 dataset. Upregulated genes are indicated in red, downregulated genes in green, and non-significant genes in black. B) Heatmap of DEGs between venous thrombosis patients and normal controls in the GSE48000 dataset. Red denotes upregulated genes, and blue denotes downregulated genes
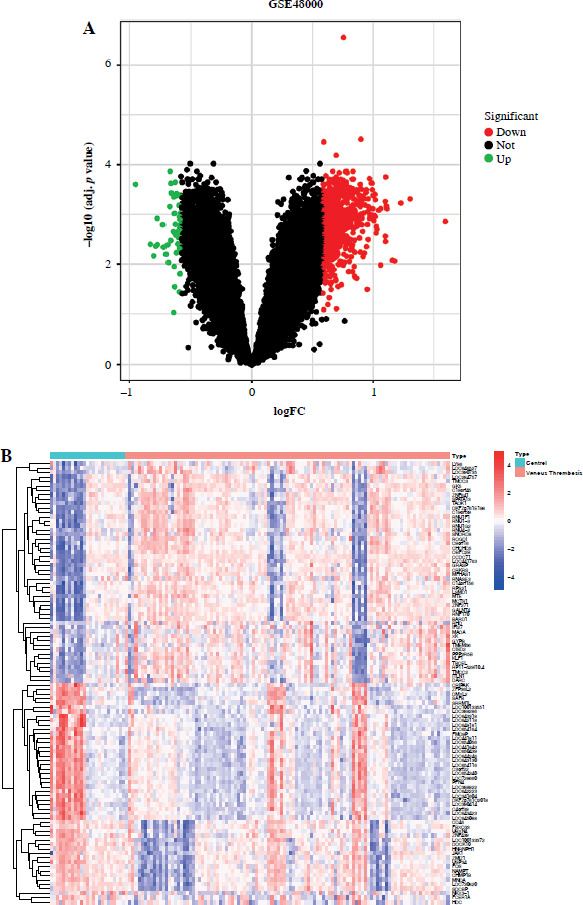
Fig. 1. Cont.
C) Volcano plot of DEGs between COVID-19 patients and normal controls in the GSE171110 dataset. Upregulated genes are indicated in red, downregulated genes in green, and non-significant genes in black. D) Heatmap of DEGs between COVID-19 patients and normal controls in the GSE171110 dataset. Red denotes upregulated genes, and blue denotes downregulated genes
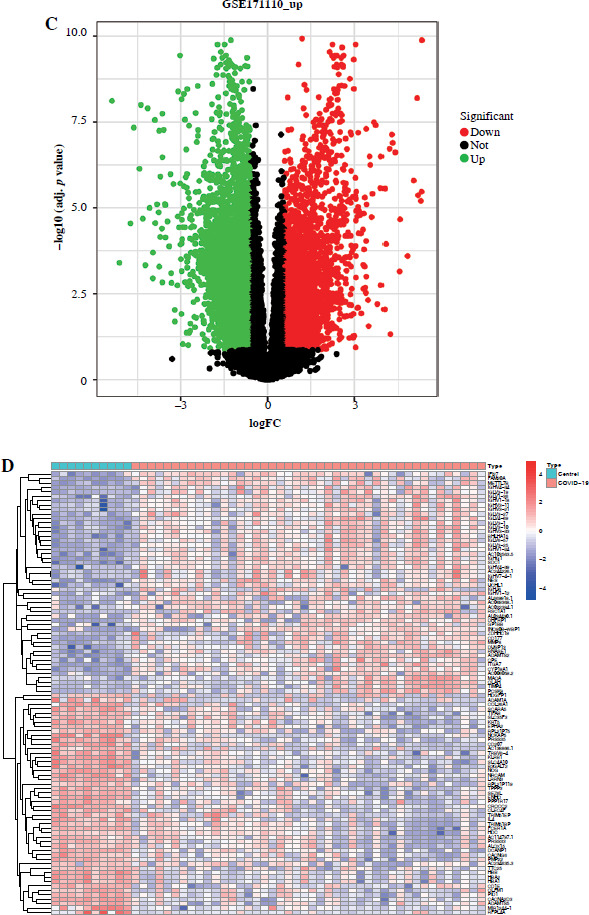
Fig. 1. Cont.
E) Venn diagram showing the overlap of upregulated genes between the GSE171110 and GSE48000 datasets. F) Venn diagram showing the overlap of downregulated genes between the GSE171110 and GSE48000 datasets. G) Gene Ontology (GO) enrichment analysis for biological process (BP), cellular component (CC), and molecular function (MF). Bubble size indicates gene number, and color represents the p-value
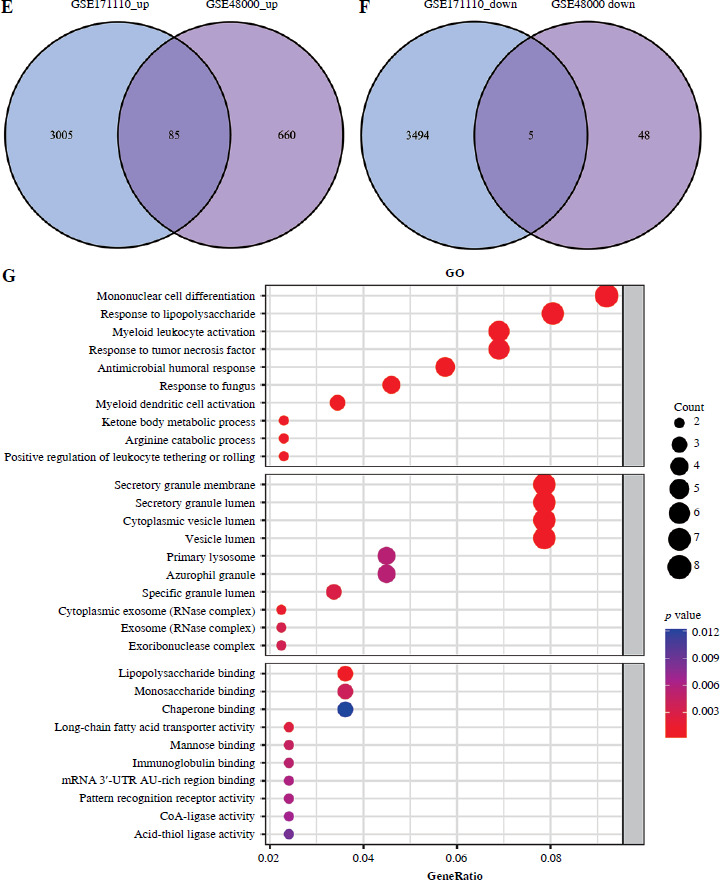
Fig. 1. Cont.
H) KEGG pathway enrichment analysis. Bubble size indicates gene number, and color represents the p-value. Significance levels in the figure: DEGs were determined with a corrected p-value < 0.05 and a fold change > 1.5. The heatmap color scale represents gene expression levels, with red indicating high expression and blue indicating low expression
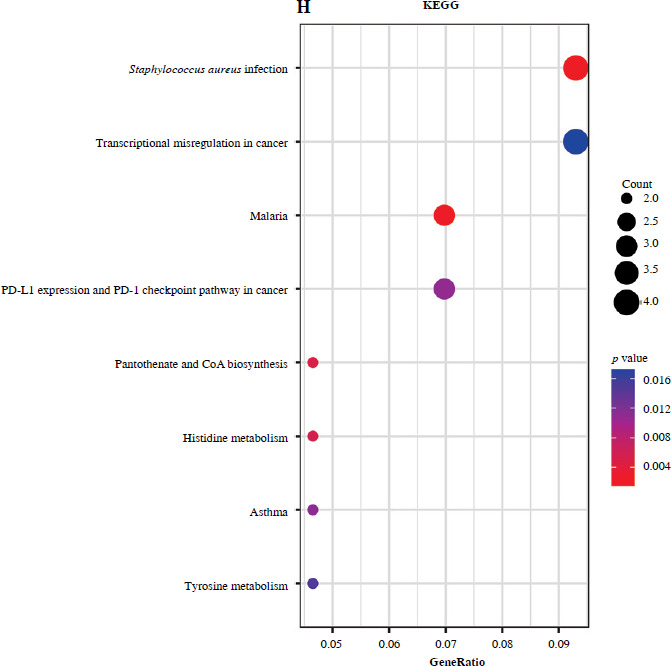
To further explore the functions of these commonly dysregulated genes, we conducted GO and KEGG enrichment analyses. The results from the GO-BP enrichment analysis indicated that these genes are primarily involved in processes such as monocyte differentiation, response to lipopolysaccharide, myeloid leukocyte activation, response to tumor necrosis factor, antimicrobial humoral response, response to fungus, myeloid dendritic cell activation, ketone body metabolic process, arginine metabolic process, and positive regulation of leukocyte adhesion or rolling (Fig. 1G). The GO-CC enrichment analysis revealed that these genes are located in cellular structures such as the secretory granule membrane, secretory granule lumen, cytoplasmic vesicle lumen, vesicle lumen, primary lysosome, azurophil granule, specific granule lumen, cytoplasmic exosome (RNase complex), exosome (RNase complex), and exosome complex (Fig. 1G). The GO-MF analysis showed that these genes possess MFs, including lipopolysaccharide binding, monosaccharide binding, chaperone binding, long-chain fatty acid transporter activity, mannose binding, immunoglobulin binding, mRNA 3′-UTR AU-rich region binding, pattern recognition receptor activity, CoA ligase activity, and acid-thiol ligase activity (Fig. 1G). KEGG pathway analysis indicated that these genes are involved in pathways such as Staphylococcus aureus infection, transcriptional misregulation in cancer, malaria, PD-L1 expression and PD-1 checkpoint pathway in cancer, pantothenate and CoA biosynthesis, histidine metabolism, asthma, and tyrosine metabolism (Fig. 1H).
Key genes and functional enrichment analysis of COVID-19 and venous thrombosis
After analyzing the DEGs from the GSE48000 and GSE171110 datasets, we constructed a PPI network and performed GO and KEGG enrichment analyses for these genes.
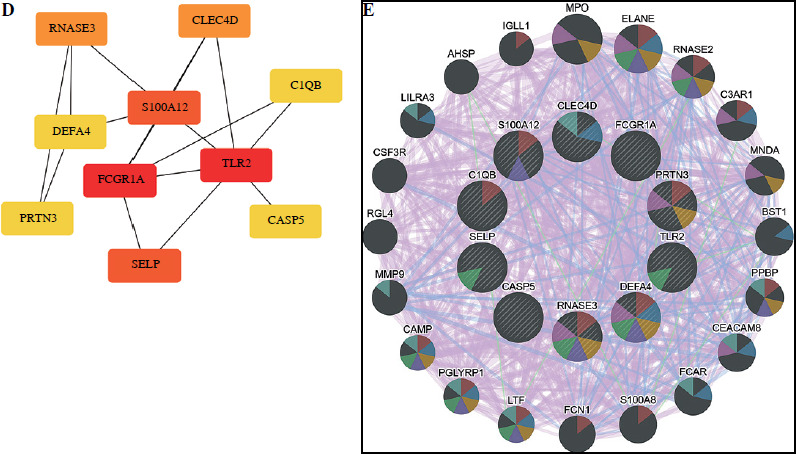
PPI network analysis revealed that several genes, including FCGR1A, TLR2, SELP, and CLEC4D, occupy central positions within the network of dysregulated genes common to both COVID-19 and venous thrombosis patients (Fig. 2A, B). Visualization of the PPI network using Cytoscape, followed by MCODE plugin analysis, identified two significant modules: Module 1, containing genes such as FCGR1A, TLR2, SELP, CLEC4D, and S100A12, and Module 2, consisting of PRTN3, RNASE3, and DEFA4 (Fig. 2C). Additionally, we employed the CytoHubba plugin to identify the top 10 hub genes within the PPI network (Fig. 2D). To further explore the interaction relationships of these key genes with other proteins, we used GeneMANIA to construct a gene-gene interaction network (Fig. 2E).
Fig. 2
Key gene network analysis in COVID-19 and venous thrombosis patients. A) PPI network of the common DEGs in COVID-19 and venous thrombosis patients. The network was constructed using the STRING database with an interaction score threshold of 0.4
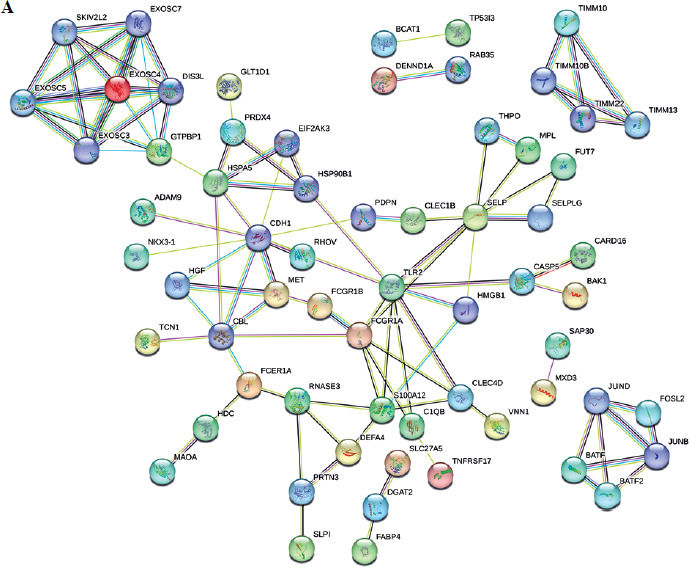
Fig. 2. Cont.
B) The gene-gene interaction network was constructed using GeneMANIA, highlighting genes that interact with the top 10 key genes. C) Two significant modules were identified in the PPI network using the MCODE plugin. Module 1 includes genes such as FCGR1A, TLR2, SELP, CLEC4D, and S100A12, while Module 2 comprises genes such as PRTN3, RNASE3, and DEFA4
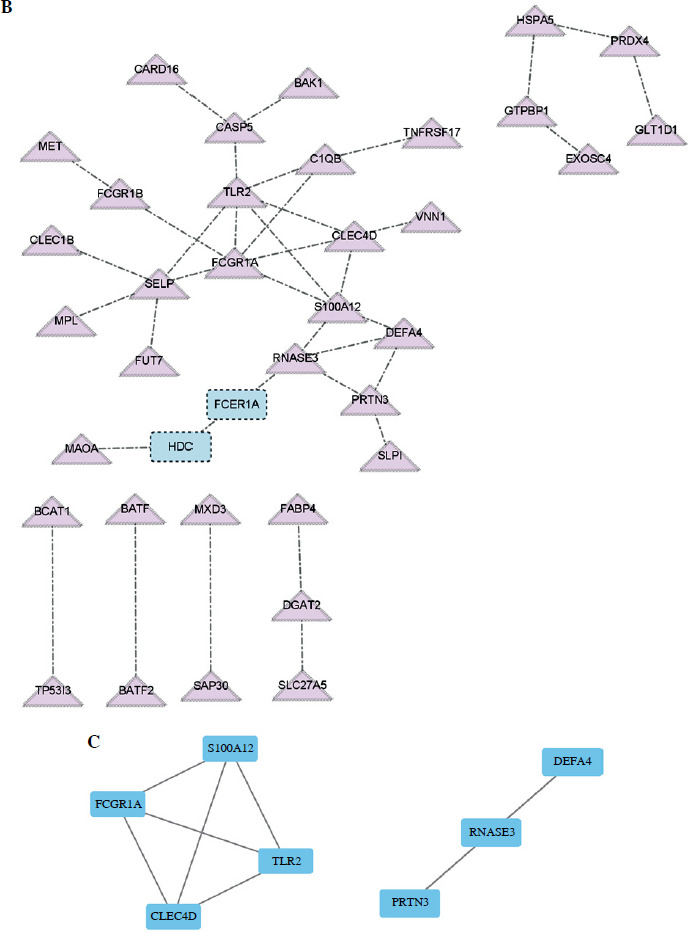
Fig. 2. Cont.
D) The top 10 key genes in the PPI network were identified using the CytoHubba plugin, with color intensity indicating the degree of centrality. E) Gene-gene interaction network constructed with GeneMANIA, illustrating the interactions between the top 10 key genes and other associated genes
To further understand the biological functions of these key genes, we conducted GO and KEGG enrichment analyses. The GO-BP analysis indicated that these genes are primarily involved in bacterial defense responses, humoral immune responses, antimicrobial humoral responses, and responses to fungi (Supplementary Fig. 1A). The GO-CC analysis revealed that these genes are mainly localized in the lumen of secretory granules, the lumen of cytoplasmic vesicles, and primary lysosomes (Supplementary Fig. 1A). The GO-MF analysis showed that these genes possess functions such as lipopolysaccharide binding, pattern recognition receptor activity, and monosaccharide binding (Supplementary Fig. 1A). KEGG pathway analysis demonstrated that these genes are implicated in several critical signaling pathways, including Staphylococcus aureus infection, neutrophil extracellular trap formation, COVID-19, and malaria (Supplementary Fig. 1B).
In summary, our findings suggest that multiple key genes exhibit significant dysregulation in both diseases and are closely associated with immune response and inflammation-related signaling pathways.
Abnormal expression of TFs and key genes in COVID-19 and venous thrombosis
We first validated the differential expression of hub genes in COVID-19 and venous thrombosis using external datasets. In the GSE189990 dataset, compared to the control group, the hub genes RNASE3, CLEC4D, DEFA4, S100A12, FCGR1A, TLR2, C1QB, PRTN3, CASP5, and SELP were upregulated in the peripheral blood of COVID-19 patients (Fig. 3A). Similarly, in the GSE19151 dataset, the hub genes RNASE3, CLEC4D, DEFA4, S100A12, FCGR1A, C1QB, PRTN3, CASP5, and SELP were upregulated in the peripheral blood of patients with venous thrombosis, while TLR2 was downregulated (Fig. 3B).
Fig. 3
TF network and expression analysis in COVID-19 and venous thrombosis patients. A) Key gene expression (TLR2, FCG R1A, SELP, S100A12, RNASE3, CLEC4D, PRTN3, C1QB, CASP5, DEFA4) boxplot in COVID-19 patients (blue) and normal controls (red). B) Key gene expression boxplot in venous thrombosis patients (blue) and normal controls (red). C) TF-target gene interaction network for key genes. TFs were predicted using the TRRUST database, and interaction networks were constructed using Cytoscape software. *p < 0.05, **p < 0.01, ***p < 0.001, ****p < 0.0001
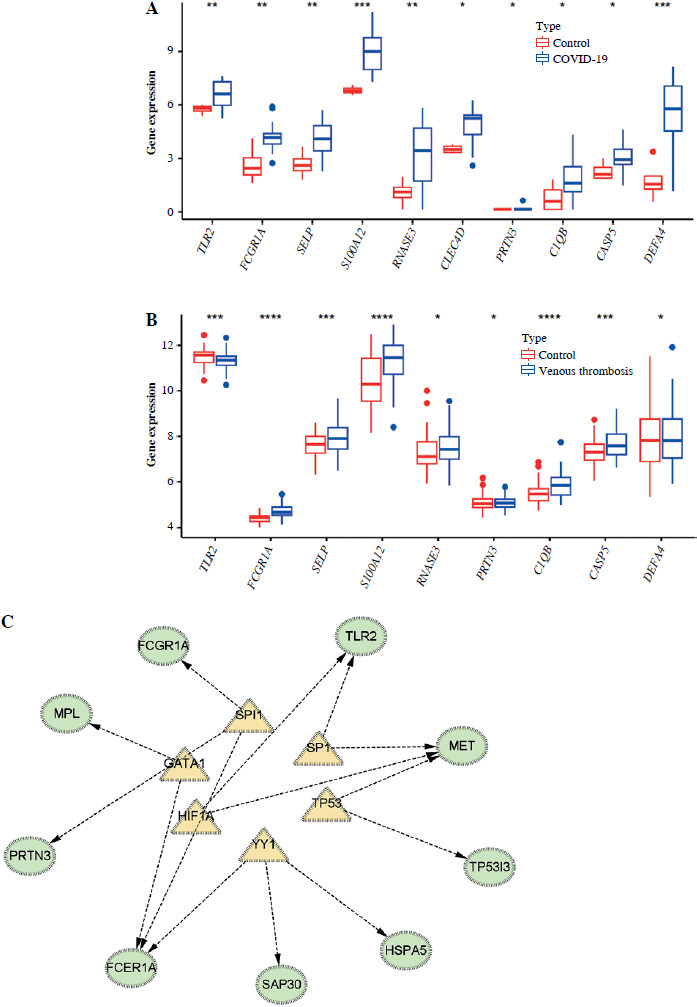
Fig. 3. Cont.
D) Box plots of TF expression (SPI1, YY1, GATA1, HIF1A, TP53, SP1) in venous thrombosis patients (blue) compared to normal controls (red). E) Box plots of TF expression (SPI1, YY1, GATA1, HIF1A, TP53, SP1) in COVID-19 patients (blue) compared to normal controls (red). *p < 0.05, **p < 0.01, ***p < 0.001, ****p < 0.0001
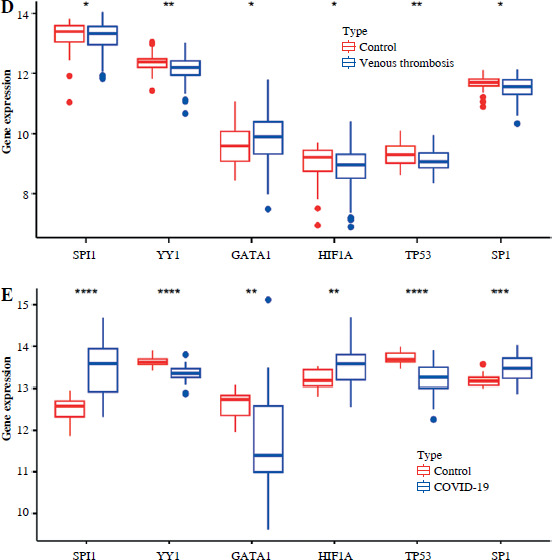
In further analysis, we used the TRRUST database to predict the TFs of these key genes and constructed a TF-target gene network (Fig. 3C). The results indicated that SPI1, GATA1, HIF1A, YY1, TP53, and SP1 are the primary TFs regulating the expression of multiple key genes. Figure 3D shows the expression levels of these TFs in patients with venous thrombosis, revealing that some TFs are downregulated in these patients. Figure 3E presents the expression levels of these TFs in COVID-19 patients, demonstrating that certain TFs are upregulated in this group.
The analysis reveals significant changes in the expression of multiple key genes and transcription factors (TFs) in both COVID-19 and venous thrombosis patients. The complex regulatory relationships between these genes and TFs further support the existence of shared molecular mechanisms underlying these two diseases.
miRNA-target gene regulatory network analysis of COVID-19 and venous thrombosis
To further investigate the shared molecular mechanisms between COVID-19 and venous thrombosis, we analyzed differentially expressed miRNAs in the GSE178246 dataset and constructed a miRNA-target gene regulatory network for key genes.
In the GSE178246 dataset, a total of 664 miRNAs exhibited significant expression changes between COVID-19 patients and normal controls, with 309 miRNAs being upregulated and 355 downregulated (Fig. 4A). The heatmap in Figure 4B displays the top 100 most differentially expressed miRNAs, with upregulated miRNAs marked in red and downregulated miRNAs in blue.
Fig. 4
miRNA-target gene regulatory network in COVID-19 and venous thrombosis patients. A) Volcano plot showing differentially expressed miRNAs in COVID-19 patients (red) compared to normal controls (green) from the GSE178246 dataset. Significantly upregulated miRNAs are marked in red, downregulated miRNAs in green, and non-significant miRNAs in black. B) Heatmap of differentially expressed miRNAs from the GSE178246 dataset, with red indicating upregulation and blue indicating downregulation
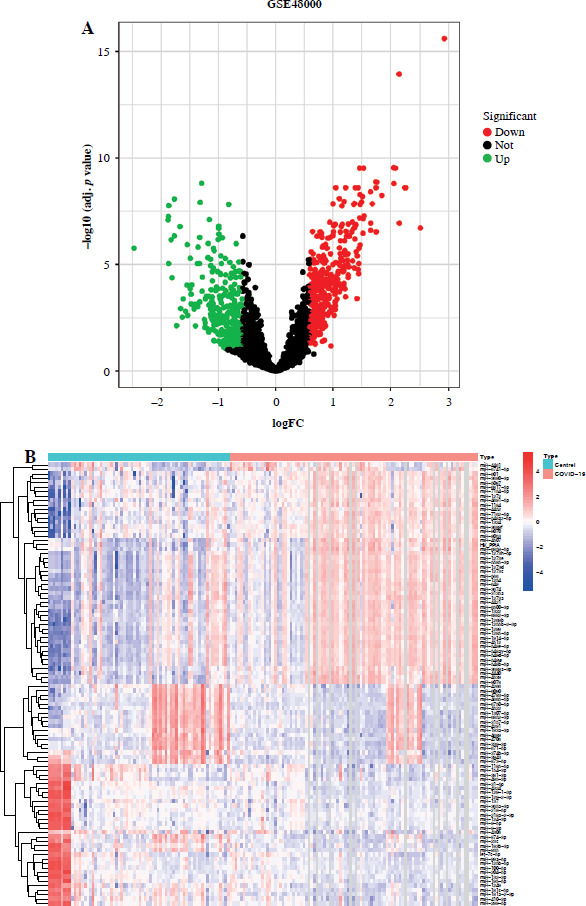
Fig. 4. Cont.
C) Venn diagram illustrating the overlap between differentially expressed miRNAs and key genes in COVID-19 and venous thrombosis. The yellow section represents key genes, the blue section represents differentially expressed miRNAs, and the intersection highlights miRNAs commonly regulated. D) miRNA-target gene regulatory network, showcasing key genes such as CLEC4D, TLR2, FCGR1A, SELP, DEFA4, C1QB, RNASE3, and S100A12, along with their corresponding regulatory miRNAs
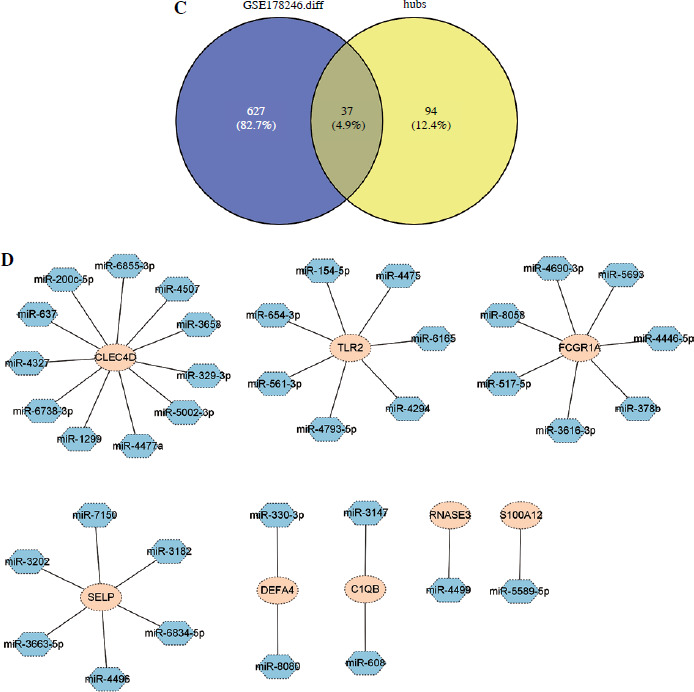
To identify miRNAs associated with both COVID-19 and venous thrombosis-related key genes, we performed an intersection analysis of the differentially expressed miRNAs and the key genes. The results revealed that 37 miRNAs were involved in regulating these key genes (Fig. 4C). The miRNA-target gene regulatory network construction indicated that key genes such as CLEC4D, TLR2, FCGR1A, SELP, DEFA4, C1QB, RNASE3, and S100A12 are regulated by multiple miRNAs (Fig. 4D).
These findings indicate the existence of a complex regulatory network between differentially expressed miRNAs and shared key genes in patients with COVID-19 and venous thrombosis. Specifically, CLEC4D is regulated by miR-6855-3p, miR-200c-5p, and miR-4507, among others; TLR2 is regulated by miR-154-5p, miR-4475, and miR-654-3p; FCGR1A is regulated by miR-4690-3p, miR-5693, and miR-8058; SELP is regulated by miR-7150, miR-3202, and miR-3182; and DEFA4, C1QB, RNASE3, and S100A12 are also regulated by various miRNAs (Fig. 4D).
In conclusion, our results suggest that multiple mi-RNAs play crucial regulatory roles in both diseases, revealing potential therapeutic targets.
Drug sensitivity analysis of key genes in COVID-19 and venous thrombosis
To explore the relationship between the expression of key genes and drug sensitivity in patients with COVID-19 and venous thrombosis, we conducted a drug sensitivity analysis using the CellMiner database. This analysis evaluated the correlation between several key genes and various chemotherapeutic drugs. Specifically, we selected 15 drugs and analyzed the correlation between their GI50 and the expression levels of the key genes.
The results of the correlation analysis between key genes and drug sensitivity are presented in Figure 5. Notably, FCGR1A exhibited the highest correlation with imexon (Cor = 0.648, p < 0.001), followed by S100A12 with ABT-199 (Cor = 0.638, p < 0.001), RNASE3 with imexon (Cor = 0.632, p < 0.001), and DEFA4 with ABT-199 (Cor = 0.631, p < 0.001). Additionally, PRTN3 showed a significant positive correlation with imexon (Cor = 0.606, p < 0.001), as did CLEC4D with cyclophosphamide (Cor = 0.606, p < 0.001).
Fig. 5
Correlation analysis between key gene expression and drug sensitivity. Correlation analysis was conducted using the CellMiner database to assess the relationship between key genes (e.g., FCGR1A, S100A12, RNASE3, DEFA4, PRTN3, CLEC4D) and 15 drugs (e.g., imexon, ABT-199, cyclophosphamide, hydroxyurea). The correlation coefficients (Cor) and significance levels (p-values) are presented in the figure
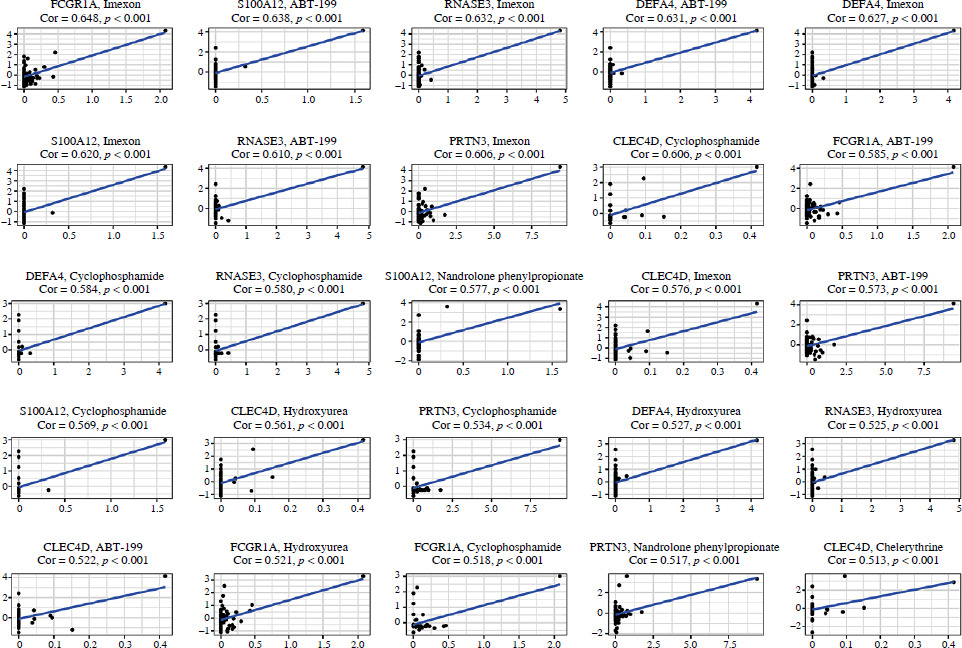
Further analysis revealed a significant positive correlation between several genes, including S100A12, RNASE3, DEFA4, CLEC4D, and PRTN3, and various drugs such as cyclophosphamide, hydroxyurea, and nandrolone phenylpropionate. For instance, S100A12 showed a correlation with cyclophosphamide (Cor = 0.569, p < 0.001), RNASE3 with cyclophosphamide (Cor = 0.580, p < 0.001), DEFA4 with cyclophosphamide (Cor = 0.584, p < 0.001), and CLEC4D with hydroxyurea (Cor = 0.561, p < 0.001).
These findings suggest that the high expression of these key genes is associated with increased sensitivity to specific chemotherapeutic drugs, indicating their potential role in drug therapy.
LASSO regression model and key gene expression analysis of COVID-19 and venous thrombosis
To further identify diagnostic biomarkers for COVID-19 and venous thrombosis, we employed the LASSO regression model for feature gene selection in the GSE48000 and GSE171110 datasets. Additionally, we assessed the diagnostic capabilities of these genes.
In the GSE48000 dataset, four feature genes – SELP, CLEC4D, C1QB, and CASP5 – were identified using the LASSO regression model (Fig. 6A). The ROC curve analysis revealed that the model constructed with these genes achieved an AUC value of 0.807 for diagnosing venous thrombosis (Fig. 6B), indicating a high diagnostic performance. Similarly, in the GSE171110 dataset, the same feature genes – SELP, CLEC4D, C1QB, and CASP5 – were identified using the LASSO regression model (Fig. 6C). This model demonstrated an AUC value of 1.0, reflecting an extremely high diagnostic accuracy (Fig. 6D).
Fig. 6
LASSO regression model and expression analysis of key genes in COVID-19 and venous thrombosis. A) Cross-validation curve (left) and lambda selection curve (right) for the feature genes identified using the LASSO regression model in the GSE48000 dataset. B) ROC curve of the LASSO model in the GSE48000 dataset, with an AUC of 0.807. C) Cross-validation curve (left) and lambda selection curve (right) for the feature genes identified using the LASSO regression model in the GSE171110 dataset
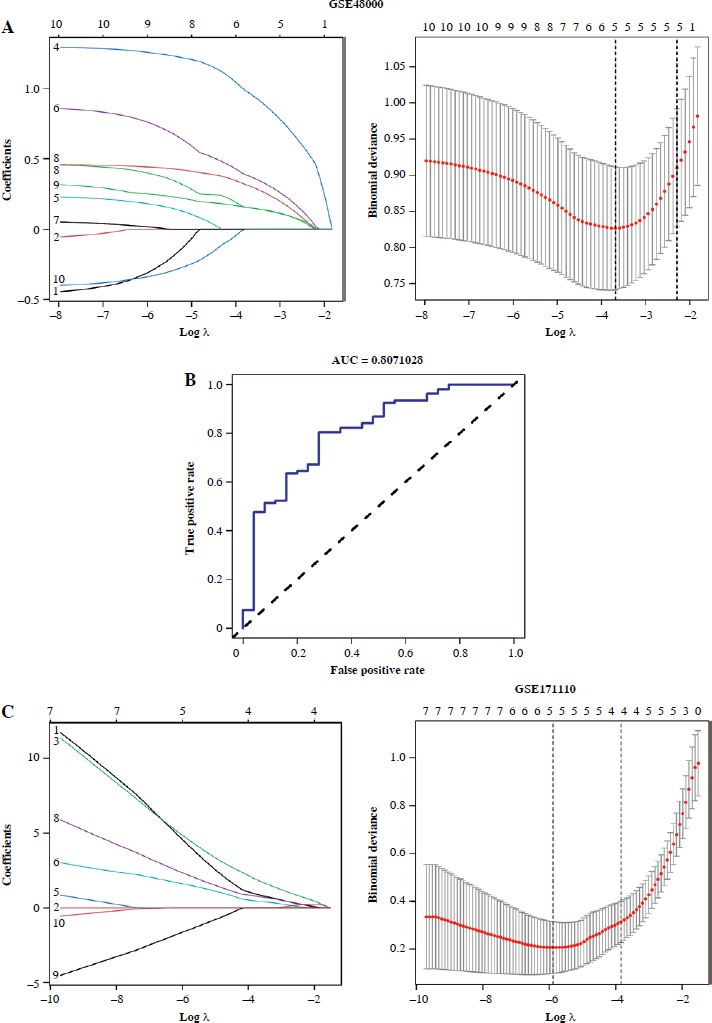
Fig. 6. Cont.
D) ROC curve of the LASSO model in the GSE171110 dataset, with an AUC of 1. E) Venn diagram of the feature genes identified in the GSE48000 and GSE171110 datasets. F) Box plots showing the expression levels of feature genes (SELP, CLEC4D, C1QB, CASP5) in venous thrombosis patients (T) and normal controls (C) in the GSE48000 dataset. G) Box plots showing the expression levels of feature genes in COVID-19 patients (T) and normal controls (C) in the GSE171110 dataset. ***p ???, ****p < 0.0001
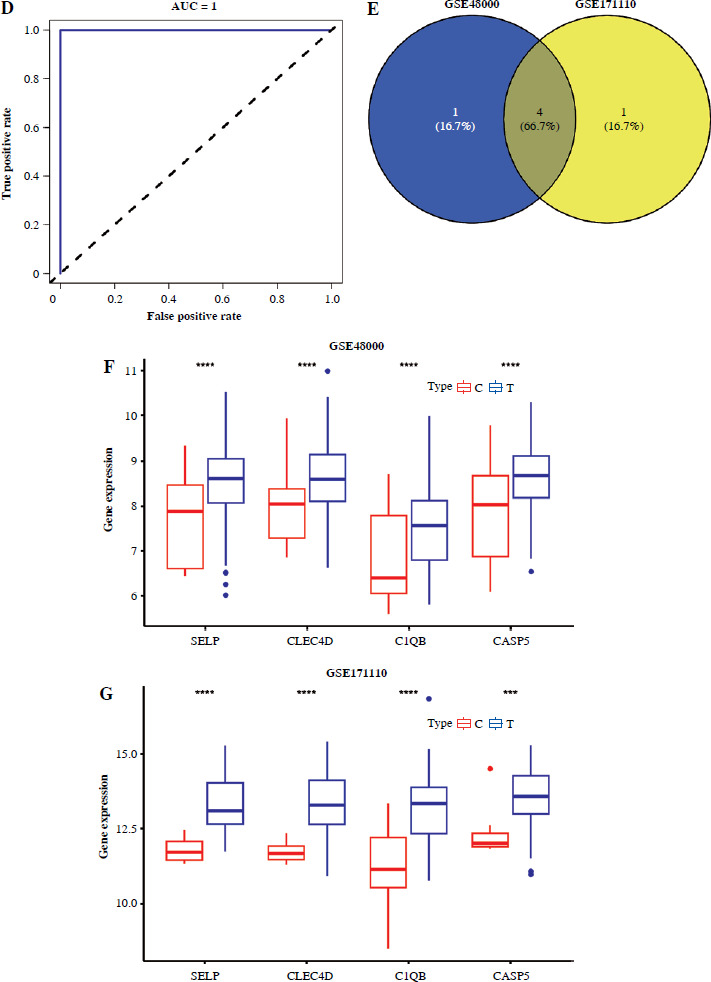
We further compared the feature genes identified in the GSE48000 and GSE171110 datasets and found that four genes (SELP, CLEC4D, C1QB, and CASP5) were common between the two. These four genes exhibited significant differential expression in both diseases (Fig. 6E).
Figure 6F and 6G illustrates the expression levels of characteristic genes in the GSE48000 and GSE171110 datasets among patients with venous thrombosis and COVID-19. The results demonstrate that the expression of these genes is significantly higher in the patient groups compared to the control groups (p < 0.001), further supporting their potential as diagnostic biomarkers.
The feature genes identified through the LASSO regression model and their elevated expression levels demonstrate significant roles in COVID-19 and venous thrombosis. These findings not only provide reliable molecular markers for the diagnosis of both diseases but also offer new insights for further research into their pathological mechanisms and targeted therapies.
Immunoinfiltration analysis reveals immune correlations of key genes in COVID-19 and venous thrombosis
To investigate the immune infiltration profiles of key genes in COVID-19 and venous thrombosis patients, we conducted an immunoinfiltration analysis using the GSE48000 and GSE171110 datasets. This analysis involved evaluating the expression levels of genes such as SELP, CLEC4D, C1QB, and CASP5 in various immune cells, aiming to elucidate their roles within the immune microenvironment.
Figure 7A-D illustrates the immune cell infiltration levels of SELP, CLEC4D, C1QB, and CASP5 in patients with venous thrombosis compared to normal controls within the GSE48000 dataset. The results indicate that the expression of these genes is significantly higher in various immune cells, including T cells, B cells, and natural killer cells, than in the control group (p-values are provided in the figure). Similarly, Figure 7E-H presents the immune cell infiltration of these genes in COVID-19 patients versus normal controls within the GSE171110 dataset. The data also demonstrate significantly elevated expression of these genes in the immune cells of COVID-19 patients (p-values are provided in the figure).
Fig. 7
Immune infiltration analysis of key genes in COVID-19 and venous thrombosis patients. A-D) Immune cell infiltration of SELP, CLEC4D, CASP5, and C1QB sin venous thrombosis patients vs. normal controls in the GSE48000 dataset. Significance levels are indicated as marked
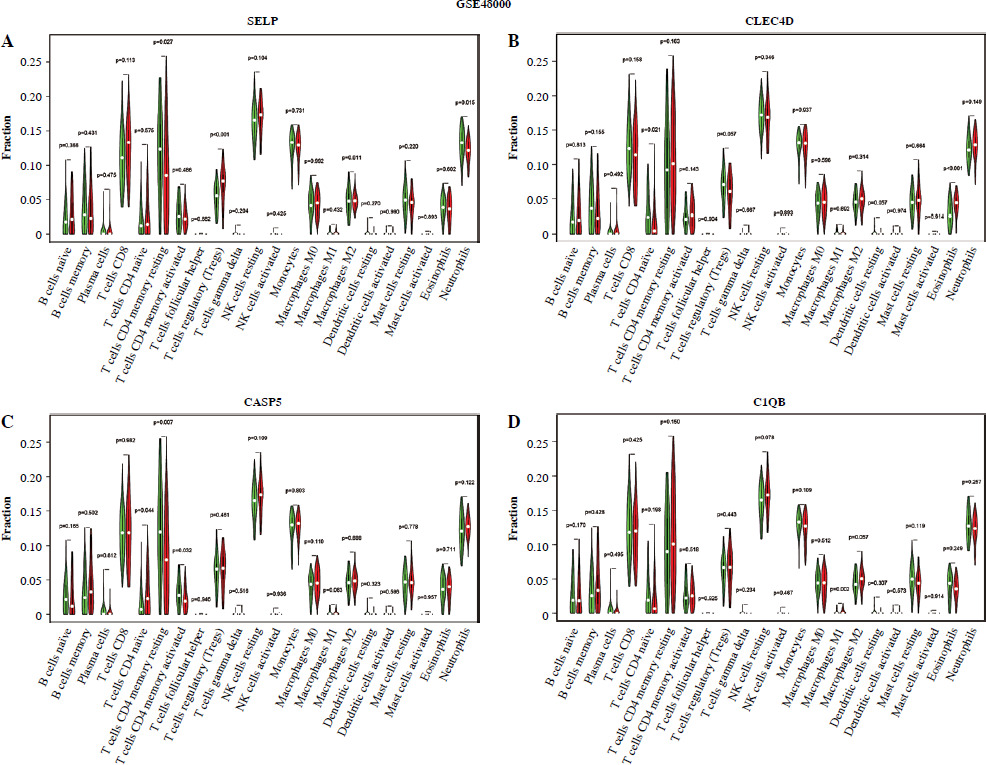
Fig. 7. Cont.
E-H) Immune cell infiltration of SELP, CLEC4D, CASP5, and C1QB in COVID-19 patients vs. normal controls in the GSE171110 dataset. Significance levels are indicated as marked
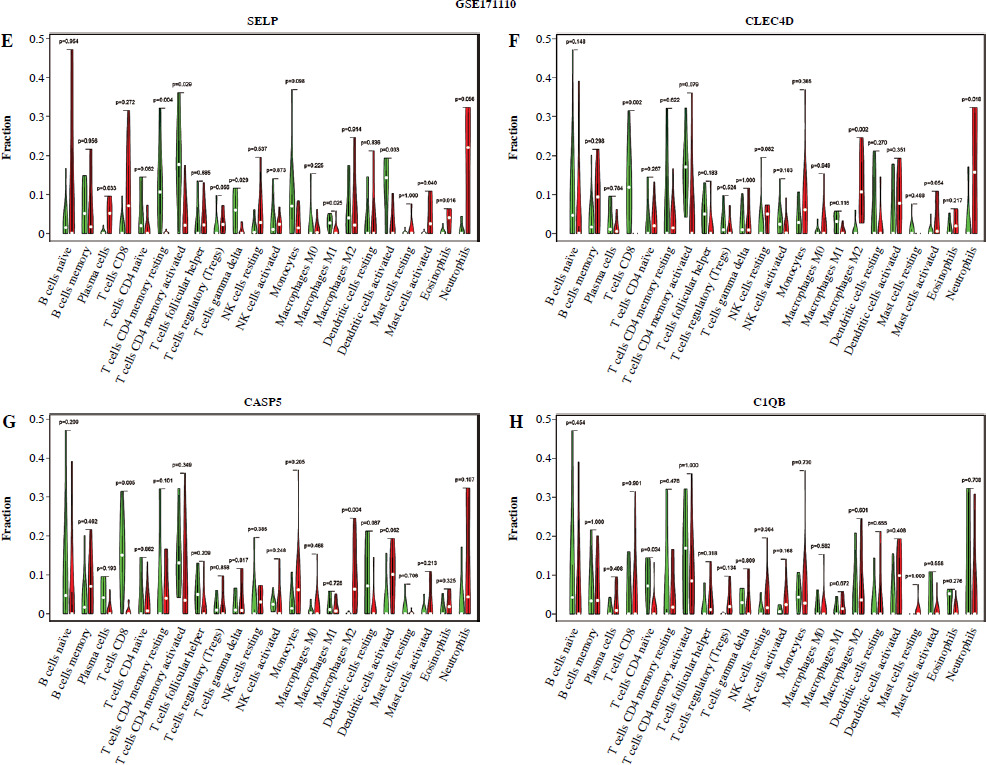
Specifically, SELP is highly expressed in T cells and macrophages of patients with venous thrombosis and COVID-19, while CLEC4D shows significantly elevated expression in dendritic cells and natural killer cells. C1QB is predominantly expressed in B cells and monocytes, and CASP5 exhibits markedly high expression across various immune cell types.
These findings suggest that the elevated expression of key genes such as SELP, CLEC4D, C1QB, and CASP5 in patients with COVID-19 and venous thrombosis is closely associated with immune cell infiltration, indicating that these genes may play a critical role in immune responses and inflammatory processes.
The genes SELP, CLEC4D, C1QB, and CASP5 play crucial roles in the formation of venous thrombosis
Following an in-depth analysis of the expression and function of key genes SELP, CLEC4D, C1QB, and CASP5 in COVID-19 and venous thrombosis patients, we conducted animal experiments to further validate the roles of these genes in venous thrombosis formation. We systematically assessed the expression of these key genes and the pathological characteristics of thrombus tissues through H&E staining, qRT-PCR, and immunohistochemistry.
The results of H&E staining revealed the formation of distinct thrombi within the venous walls of the model group mice. The thrombus structure was clearly defined and significantly increased compared to the blank control and sham-operated groups (Supplementary Fig. 2). Specifically, the model group exhibited increased venous wall thickness and higher thrombus tissue density, whereas the venous wall structure in the blank control and sham-operated groups remained normal, with no evident thrombus formation.
The qRT-PCR analysis further confirmed the gene expression levels of key genes in venous thrombosis tissues. The results revealed that the mRNA expression levels of SELP, CLEC4D, C1QB, and CASP5 were significantly higher in the model group compared to the control and sham groups (Fig. 8A). Specifically, SELP expression increased approximately 3-fold (p < 0.001), CLEC4D by about 4-fold (p < 0.001), C1QB by approximately 3.5-fold (p < 0.001), and CASP5 by around 2.5-fold (p < 0.001).
Fig. 8
qRT-PCR and immunohistochemical analysis of key genes in a venous thrombosis animal model. A) qRT-PCR results demonstrate significant upregulation of SELP, CLEC4D, C1QB, and CA SP5 gene expression in thrombus tissues compared to the control and sham groups. ***p < 0.001. B) Immunohistochemical analysis shows a significant increase in the protein expression levels of SELP, CLEC4D, C1QB, and CASP5 in the venous thrombosis tissues of mice compared to the control and sham groups
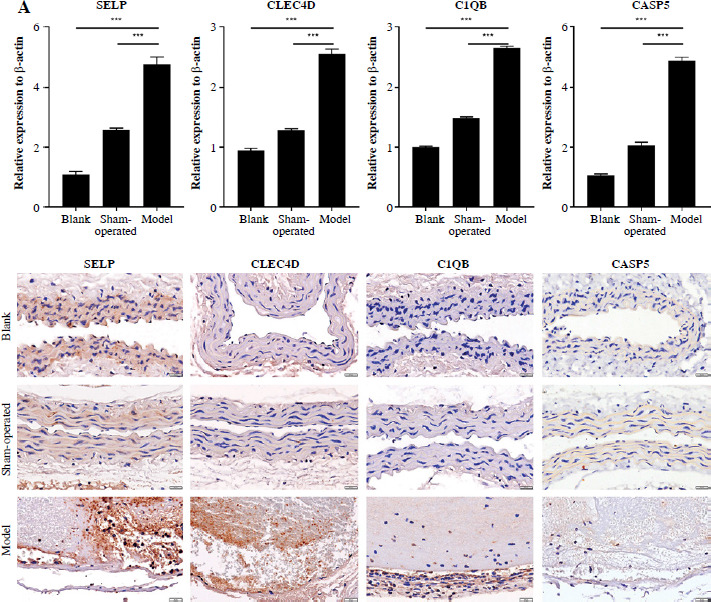
Immunohistochemical analysis showed that the protein expression levels of SELP, CLEC4D, C1QB, and CASP5 were also significantly upregulated in venous thrombosis tissues of the mouse model relative to the control and sham groups (Fig. 8B). Specifically, SELP expression was primarily localized in vascular endothelial cells and thrombus regions, CLEC4D was markedly overexpressed in inflammatory cells, C1QB expression increased in cells associated with the complement system, and CASP5 showed a significant increase across multiple cell types, indicating its crucial role in inflammation and apoptosis.
The experimental results strongly support previous clinical data, demonstrating that SELP, CLEC4D, C1QB, and CASP5 play significant roles in the formation of venous thrombosis. Specifically, H&E staining revealed noticeable thrombus formation within the venous walls of the model group mice. qRT-PCR analysis showed that the mRNA expression levels of these genes were significantly higher in the model group compared to the control group, while immunohistochemistry results indicated a marked increase in protein expression levels in the thrombus tissues. These findings not only validate the critical roles of these genes in venous thrombosis formation but also provide a solid foundation for further mechanistic studies.
The animal experiments further confirmed the importance of SELP, CLEC4D, C1QB, and CASP5 in the development of venous thrombosis. These results provide robust experimental evidence for the future development of new diagnostic and therapeutic strategies.
Discussion
Since its outbreak in 2019, COVID-19 has rapidly spread worldwide, leading to millions of infections and deaths [11]. Among the common complications in COVID-19 patients, venous thrombosis has garnered significant attention [12]. Studies have shown that the incidence of venous thrombosis is significantly higher in COVID-19 patients compared to the general population, potentially due to the widespread inflammatory response and vascular endothelial injury induced by COVID-19 [13, 14]. However, most existing research has focused primarily on the clinical manifestations and treatment of COVID-19, with relatively few studies investigating the shared molecular mechanisms underlying COVID-19 and venous thrombosis [15]. This study aimed to reveal the shared molecular mechanisms between COVID-19 and venous thrombosis through a comprehensive analysis of multiple datasets. This integrative approach provides new insights into the relationship between these two conditions, with significant improvements in data volume, analysis depth, and biological relevance compared to previous studies. The novelty of this research lies in the systematic screening and analysis of shared differential genes between COVID-19 and venous thrombosis, laying the groundwork for a deeper exploration of their molecular connections.
In this study, the screening results for differential genes revealed a series of shared genes between COVID-19 and venous thrombosis, primarily associated with immune response and inflammatory processes. Previous research has consistently shown that the pathological features of COVID-19 include abnormal activation of the immune system, while the formation of venous thrombosis is closely linked to inflammatory responses [16]. Our findings further corroborate this connection by demonstrating significant upregulation of immune-related gene expression in patients with COVID-19 and venous thrombosis. It aligns with previous studies that separately analyzed the genetic profiles of COVID-19 and venous thrombosis. Additionally, we identified several differential genes that have not been widely reported before, offering new insights into the shared mechanisms underlying these conditions.
The PPI analysis further elucidated the molecular mechanisms underlying the interaction between COVID-19 and venous thrombosis. Through PPI network analysis, several key hub genes, including SELP and CLEC4D, were identified. The SELP gene encodes P-selectin, which is known to be associated with platelet activation and thrombosis, while the CLEC4D gene plays a role in the regulation of immune cell function. Previous studies have primarily focused on the roles of these genes in individual diseases. However, this study is the first to link them simultaneously to both COVID-19 and venous thrombosis, suggesting that they may play a crucial role in the shared pathological processes of these conditions. These findings not only enhance our understanding of the molecular biology involved but also offer potential new therapeutic targets.
In the analysis of TF and miRNA regulatory networks, our study constructed a regulatory network that revealed the critical roles of various TFs and miRNAs in COVID-19 and venous thrombosis. Notably, TFs closely associated with immune regulation and inflammatory response, such as NF-κB, demonstrated significant regulatory effects. Additionally, the analysis of the miRNA network identified several miRNAs with potential regulatory capabilities, such as miR-155, which has been frequently reported as a regulator of inflammatory diseases in previous studies. However, its dual role in COVID-19 and venous thrombosis has not yet been fully validated. This network construction provides a basis for future in-depth exploration of these regulatory factors in both diseases.
Regarding drug sensitivity analysis, our study identified correlations between the SELP and CLEC4D genes and the sensitivity to specific chemotherapeutic drugs. Previous research has largely focused on the drug responses of these genes in cancer or single-disease contexts, making this finding novel in the context of COVID-19 and venous thrombosis. The drug sensitivity analysis suggests that these genes may influence patient responses to certain medications, indicating their potential as biomarkers for personalized treatment. Future drug development and clinical trials targeting these genes could offer more precise therapeutic options for patients, presenting new avenues for drug development.
The diagnostic value of this study is further reinforced by the LASSO regression and immune infiltration analyses. Key genes identified through LASSO regression, such as SELP and CLEC4D, demonstrate high diagnostic potential, surpassing previously recognized biomarkers in specificity and sensitivity. Moreover, immune infiltration analysis reveals significant differential expression of these genes in specific immune cells, which aligns closely with the immunopathological characteristics of COVID-19 and venous thrombosis. These findings not only offer novel approaches for the early diagnosis of COVID-19 and venous thrombosis but also provide new insights into their immune mechanisms.
This study analyzed transcriptomic data from multiple publicly available datasets, focusing on identifying the shared molecular mechanisms between COVID-19 and venous thrombosis. While the findings provide important insights, integrating all datasets through meta-analysis of transcriptomic data will further enhance the robustness and generalizability of the results. Such meta-analysis helps reduce biases from individual datasets, improve statistical power, and reveal more comprehensive shared molecular pathways. Future research will explore this direction, using integrative analysis to further investigate the relationship between COVID-19 and venous thrombosis and optimize potential biomarkers and therapeutic targets. Furthermore, analyses based on existing databases are limited by sample diversity and control over experimental conditions. Future research requires more original clinical data and randomized controlled trials to validate these findings and explore the universality of these markers across different populations and geographic regions. Additionally, further investigation into the biological functions and mechanisms of these markers provides a stronger foundation for precise diagnosis and personalized treatment of these diseases.
Conclusions
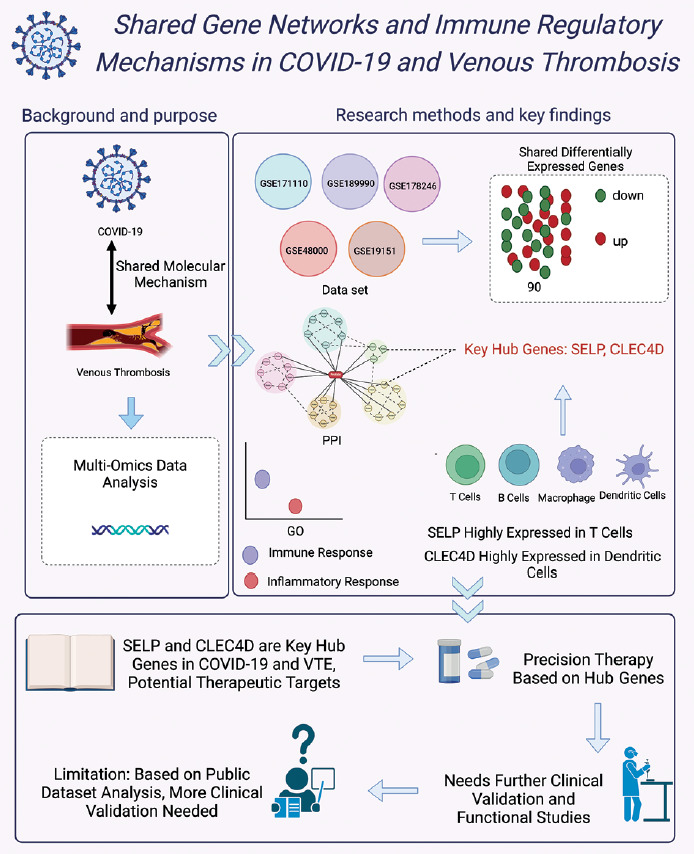
This study, through a comprehensive analysis of publicly available transcriptomic and miRNA data, is the first to reveal shared molecular markers and key hub genes, such as SELP and CLEC4D, between COVID-19 and venous thrombosis at the molecular level. The aberrant expression of these genes is closely associated with immune response and inflammatory processes, suggesting potential shared pathological mechanisms between the two diseases (Fig. 9). Moreover, the study underscores the role of immune cells in disease progression through immune infiltration analysis, providing critical insights for the development of new therapeutic strategies. Further animal experiments also indicate that SELP, CLEC4D, C1QB, and CASP5 play significant roles in the formation of venous thrombosis.