Introduction
CD4 T cells plays an important role in regulation of health and disease through regulation of the immune system. CD4 T cells are believed to differentiate into different subtypes under different stimulation of cytokine combinations, including Th1, Th2, Th17, Th9, Th22, and Treg cells [1]. Among these subtypes, Th17 is characterized by secretion of interleukin (IL)-17A and IL-17F, which is regulated by the transcription factor RORγt, leading to the occurrence of autoimmune disease [2]. Regulatory T cells suppress the inflammatory process by secretion of inhibitory cytokines, such as IL-10, or direct engagement of inhibitory molecules, such as TIGIT and CTLA-4 [3]. Th17 cells mostly mediate autoimmunity and antitumor immunity, whereas Treg cells promote immune tolerance [4]. The balance between Th17 and Treg cells determines whether the immune response leads to disease or maintains health.
Glutamine is critical for the proliferation of cells as an essential amino acid [5]. Activated T cells upregulate glutamine transporters and metabolic enzymes [6]. The upregulation of glutamine transporter in activated T cells was discovered several years ago [7]. Removal of glutamine significantly inhibited the proliferation and activation of T cells, reduced the expression of IL-2 and interferon γ (IFN-γ), and impaired T cell function [8]. Glutamine is catalyzed into glutamate by glutaminase (GLS) [9], which is further catalyzed into glutathione for protein synthesis, reactive oxygen species (ROS) generation, and cystine uptake [10]. Additionally, glutamate can be converted into α-ketoglutarate (α-KG), supporting the tricarboxylic acid cycle (TCA) cycle, which is critical for the histone and DNA demethylases, thereby regulating the accessibility of chromatin [11]. Therefore, we hypothesized that glutamate may be a critical regulator for Th17 and Treg differentiation, influencing the immune balance and disease development.
In this study, we first analyzed the difference between Th17 and Treg cells using cellular proteomics and secretomes, identifying differential regulation of glutamine metabolism. Surprisingly, we found that the rate-limiting enzyme of glutamine metabolism, GLS, is specifically expressed in Treg cells, but not in Th17 cells, indicating that GLS is critical for maintaining of Treg function. To further verify this hypothesis, we detected the expression of glutamine-related enzymes at protein and mRNA levels, and obtained the same results. Using additional supplementation or removal of glutamate-related metabolites, we also confirmed the critical role of glutamate for Treg function. Hence, we hypothesized that glutamate metabolism regulated by GLS may be a potential target for treatment of autoimmune diseases.
Material and methods
Cell culture
Lymph nodes and spleen were isolated from 6-8-week-old C57/BL6J mice purchased from Charles River (Beijing, China). All mice were housed and bred under specific pathogen-free conditions at the Animal Facility of Nankai University. After grinding, cells were incubated with CD4 (L3T4) MicroBeads (130-117-043, Miltenyi Biotec) and purified by flow through the magnetic shelf. Then, CD4 cells were cultured in RPM-1640 medium (11875093, Gibco) supplied with 10% FBS (10099141C, Gibco) under different conditions: for the Th17 condition, cells were cultured with IL-6 (10 ng/ml, 575704, BioLegend) and transforming growth factor β (TGF-β; 2 ng/ml, 763104, BioLegend) [12], and for the Treg condition, cells were cultured with TGF-β (5 ng/ml) and IL-2 (10 ng/ml, 575404, BioLegend) [12]. After culture for 4 days, cells were collected for the following experiments.
FACS detection
The expression of target proteins was detected using a CytoFLEX Flow cytometer (Beckman). Intracellular staining was performed using the Fixation/Permeabilization Solution Kit (555028, BD Bioscience). Cells were fixed with fixation/permeabilization buffer for 20 min at 4oC, followed with staining with staining buffer (anti-IL-17A (506903, BioLegend), CD4 (100437, Bio- Legend) antibody, 1 : 400 dilution) for 45 min at 4oC. Intranuclear staining was performed using the Cyto-Fast Fix/Perm Buffer Set (426803, BioLegend). Cells were fixed with fixation/permeabilization buffer for 2 h at 4oC, followed by staining with staining buffer (anti-Foxp3 (320113, BioLegend) antibody, 1 : 400 dilution) for 45 min at 4oC. For Th17 cell detection, we gated the CD4/PB and IL-17A/PE positive cells; for Treg cell detection, we gated the CD4/PB and Foxp3/APC positive cells.
Protein extraction and MS sample preparation
After culture, cells were collected for protein extraction. Briefly, cells were lysed with 8 M urea supplied with proteinase inhibitor cocktail on ice, followed by reduction using 10 mM DTT for 1 h and 50 mM IAA for 30 min and then digested with MS grade trypsin (V5280, Promega) overnight at 37oC. After desalinization, peptide samples were sent for HPLC-MS/MS detection.
Secretome analysis
After culture of Th17 and Treg cells, the culture medium was collected and lysed with 2 M urea supplied with proteinase inhibitor cocktail, followed by ultrasonication on ice for 30 minutes. Then, protein was precipitated by incubation with acetone overnight. Protein samples were resuspended with 50 mM NH4HCO3, followed by reduction with 10 mM DTT for 1 h and 50 mM IAA for 30 min, then digested with trypsin overnight. After desalinization, peptide samples were sent for HPLC-MS/MS detection.
HPLC-MS/MS
Peptide samples were separated with the EASY-nLC 1200 nano LC system (Thermo Fisher, San Jose) and then analyzed using a Thermo Scientific Orbitrap Eclipse mass spectrometer (Thermo Fisher, San Jose). Solvent A was 0.1% formic acid in water, and solvent B was 0.1% formic acid in 80% acetonitrile. Samples were loaded on a trap column (Thermo Scientific Acclaim PepMap 100 C18, 75 µm*2 cm, 3 µm, 100 Å) and eluted to an analytical column (Thermo Scientific Acclaim PepMap RSLC, 75 µm*25 cm, 1.9 µm, 100 Å) from the gradient of 8%. A full scan was performed from 350 to 2000 m/z range with a resolution of 60,000.
Data analysis
Differentially expressed proteins were identified based on the Th17/Treg intensity ratio. A ratio larger than 2 or less than 0.5 was regarded as differentially expressed. The functions of these proteins were visualized using Cytoscape (version 3.9.0). The biological process and KEGG pathway analysis was performed using the DAVID online analysis tool.
Vector construction
To construct the GLS overexpression vector, GLS cDNA was inserted into the pcDNA3.1 vector, and to construct the GLS knockout vector, the GLS sequence (forward: 5′-AGATCCTACAGGAGCTGGGG-3′, reverse: 5′-GGCATCGCTTTCTTTCTCTTC-3′) was inserted into the lenti-CRISPRv2 vector. The virus was prepared using 293T cells with Lipo2000 transfection reagent, and after packing, the virus was used to transfect the T cells.
Glutamate recovery
To verify the function of the metabolite glutamine in differentiation of Th17 and Treg cells, we added glutamine to the culture medium. Briefly, on day 0 of Th17 and Treg culture, 2 mM glutamine, 2 mM glutamate, 1 mM α-KG and 1 mM GSH were added. After culture for 4 days, cells were collected for FACS detection.
RNA extraction and quantitative real-time PCR (qPCR)
RNA extraction was performed using TRIzol reagent. Briefly, Th17 and Treg cells were lysed with TRIzol, and shaken vigorously with chloroform. After centrifugation at 12,000 × g for 10 min, the aqueous phase of the sample was transferred to a new tube and incubated with isopropanol. The RNA sample was precipitated after being centrifuged at 12,000 g for 10 min. Then, the RNA sample was used to perform the reverse transcription and qPCR with a Hifair Advanced One Step RT-qPCR SYBR Green Kit (11175ES20, Yeasen). Reaction was performed as recommended in the protocol. The reaction steps were: reverse transcription at 50oC for 6 min, pre-denaturation at 95oC for 5 min, extension at 95oC for 15 s and 60oC for 30 s and repeat for 40 cycles. The primer sequences were as follows: Slc1a5: forward: 5′-CATCAACGACTCTGTTGTAGACC-3′, reverse: 5′-CGCTGGATACAGGATTGCGG-3′; Gls: forward: 5′-TTCGCCCTCGGAGATCCTAC-3′, reverse: 5′-CCAAGCTAGGTAACAGACCCT-3′; Glud1: forward: 5′-CCCAACTTCTTCAAGATGGTGG-3′, reverse: 5′-AGAGGCTCAACACATGGTTGC-3′; Cad: forward: 5′-CTGCCCGGATTGATTGATGTC-3′, reverse: 5′-GGTATTAGGCATAGCACAAACCA-3′; Gclc: forward: 5′-GGGGTGACGAGGTGGAGTA-3′, reverse: 5′-GTTGGGGTTTGTCCTCTCCC-3′; Actb: forward: 5′-GGCTGTATTCCCCTCCATCG-3′, reverse: 5′-CCAGTTGGTAACAATGCCATGT-3′. The expression of each target gene was calculated using the 2–DDCt method. Actb was used as an internal control.
ELISA
The concentrations of glutamine, glutamate, GSH/GSSG and α-KG were determined using the ELISA method. The glutamine ELISA kit (UNEB0091) was purchased from AssayGenie. Glutamate (ab83389), α-KG (ab83431) and GSH/GSSG (ab138881) ELISA kits were purchased from Abcam. The experiment was performed according to the manufacturer’s protocol. Briefly, the culture medium and serum sample were incubated with the primary antibody coated on the plate, and then incubated with the secondary antibody. After washing with washing buffer, the concentration of each metabolite was detected using a Microplate Reader at 450 nm.
Protein extraction and western blotting analysis
Cells were lysed with lysis buffer (8 M urea supplied with proteinase inhibitor cocktail), and concentrations of proteins were detected using BCA assay. The same amount of protein samples from different groups was used to perform the SDS-PAGE separation. After incubation with primary antibodies (1 : 1000 dilution, anti- SLC1A5 (ab237704), anti-GCLM (ab126704), anti- GCLC (ab190685), anti-GLS (ab113509), anti-GLUD1 (ab153973), anti-CAD (ab99313)) and secondary antibody (1 : 5000 dilution, goat anti-rabbit IgG (ab205718) and goat anti-mouse IgG (ab205719)), the expression of target proteins was detected using the chemiluminescence method.
Results
Analysis of cellular and secretion proteomics
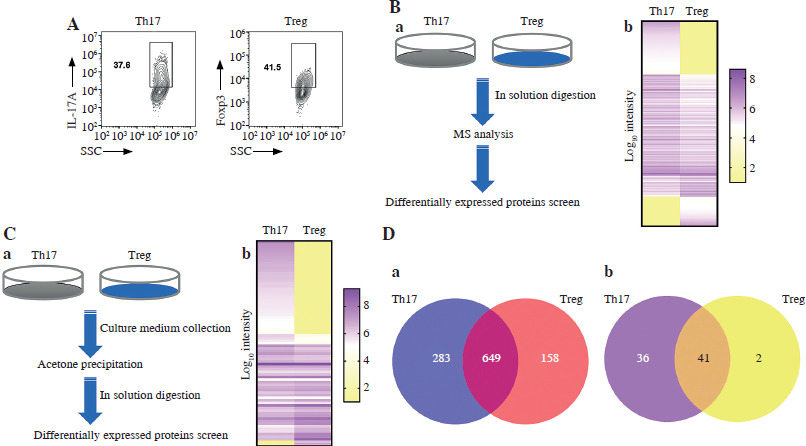
Differentiation of Th17 and Treg cells were detected using FACS by measuring the expression of IL-17A or Foxp3 expression (Fig. 1A). As regards cellular proteomics, a total of 2618 proteins were successfully screened, and 1928 proteins were successfully quantified. Among them, we screened 1090 proteins differentially expressed in Th17 and Treg cells, 159 proteins were only quantified in the Treg condition, and 284 proteins were only quantified in the Th17 condition. Among the proteins quantified in both Treg and Th17 conditions, 649 proteins were differentially expressed (with a cutoff fold-change in Th17/Treg intensity > 2 or < 0.5) (Fig. 1B, D). As regards secretion proteomics, a total of 201 proteins were screened, and 79 proteins were quantified. Among them, 24 proteins were differentially expressed in Th17 and Treg cells (with a cutoff fold-change in Th17/Treg intensity > 2 or < 0.5), 36 proteins were only quantified in the Th17 condition, and 2 proteins were quantified in the Treg condition (Fig. 1C, D). The results indicated that the protein expression pattern significantly differs between Th17 and Treg cells.
Fig. 1
Mass spectrometry (MS) of proteins in cells and culture medium of Th17 and Treg cells. A) Representative gating of Th17 and Treg cells. B) MS analysis of proteins in Th17 and Treg cells. (a) Schematic graph of total cellular protein MS sample preparation. (b) Presentation of MS results of cellular protein. C) MS analysis of proteins in culture medium of Th17 and Treg cells. (a) Schematic graph of proteins in culture medium MS sample preparation, (b) Presentation of MS results of proteins in culture medium. D) Analysis of differentially expressed proteins in cells and culture medium of Th17 and Treg cells. (a) Differentially expressed proteins of cellular proteins, (b) Differential expression of proteins in culture medium. Each experiment was repeated three times independently
Bioinformatics analysis
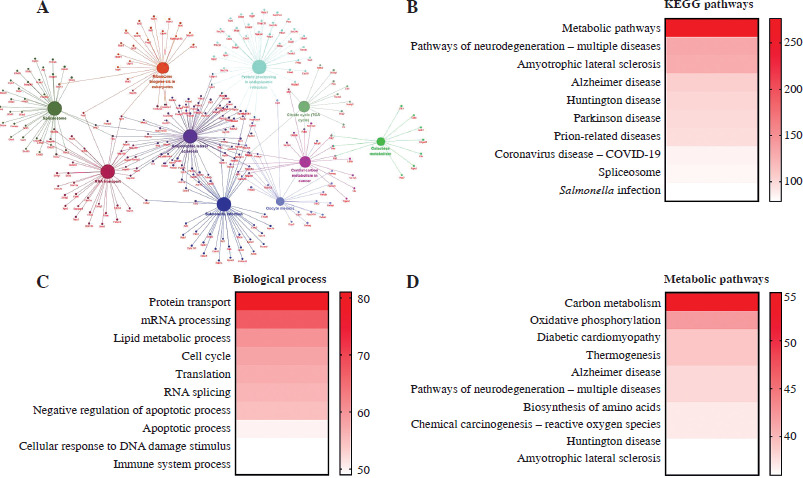
In order to explore the function of the differentially expressed proteins between Th17 and Treg groups, the differentially expressed proteins were visualized by Cytoscape (Fig. 2A). To screen the target proteins in regulation of Th17 and Treg cell generation, we analyzed the KEGG pathway (Fig. 2B) and biological processes (Fig. 2C) of the proteomics results. Based on the enriched protein number in each process, the top 10 biological processes were protein transport, mRNA processing, lipid metabolic process, cell cycle, translation, RNA splicing, negative regulation of apoptotic process, apoptotic process, cellular response to DNA damage stimulus, and immune system process. The top 10 KEGG pathways were metabolic pathways, pathways of neurodegeneration, amyotrophic lateral sclerosis, Alzheimer disease, Huntington disease, Parkinson disease, prion-related diseases, coronavirus disease, spliceosome, and Salmonella infection. These results showed that metabolic pathway are the most altered between Th17 and Treg cells (Fig. 2D). To determine which metabolic pathways, we further analyzed the distribution of metabolic pathways. Surprisingly, we found that GLS-mediated glutamate metabolism was enriched, and GLS was only expressed in Treg cells based on MS results. This indicates that glutamate may be a key regulator of Treg cell generation.
Fig. 2
Bioinformatics analysis of differentially expressed proteins. A) Cytoscape analysis of differentially expressed proteins in Th17 and Treg cells. B) KEGG pathway enrichment of differentially expressed proteins in Th17 and Treg cells. C) Biological process enrichment of differentially expressed proteins in Th17 and Treg cells. D) Metabolic pathway enrichment of differentially expressed proteins in Th17 and Treg cells
Glutamate metabolism pathway analysis
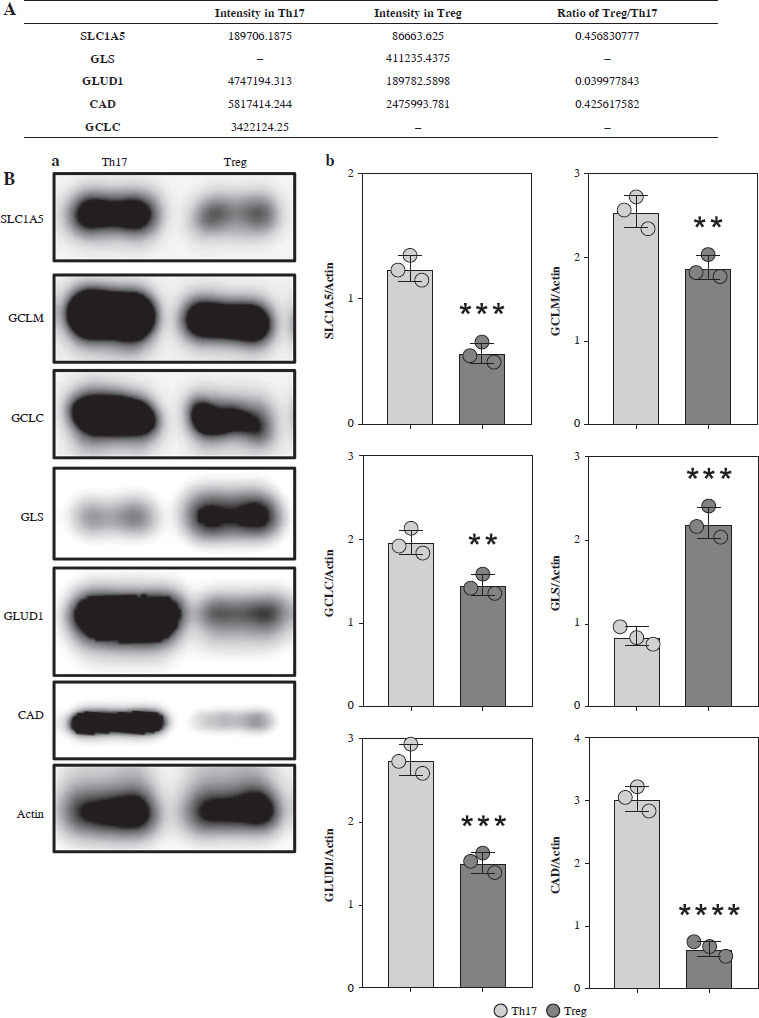
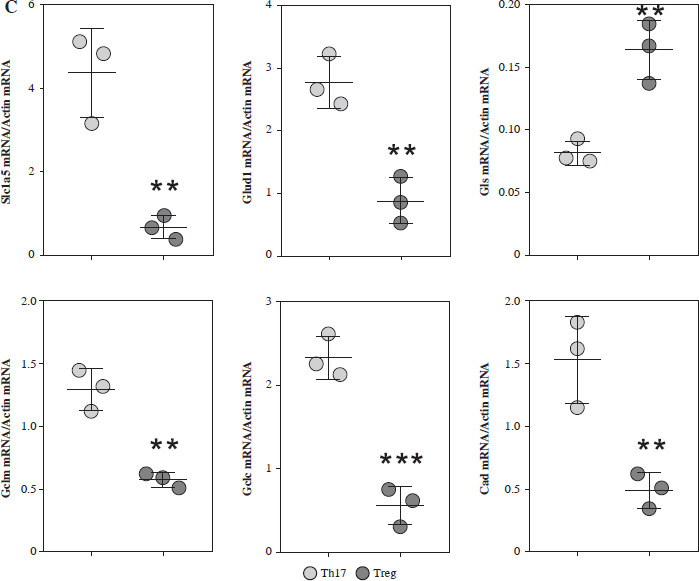
Based on the MS results, we found that SLC1A5 was highly expressed in Th17 cells, while GLS was only identified in Treg cells. Additionally, enzyme-catalyzed downstream steps of glutamate, including GLUD1, GCLC, and CAD, were all highly expressed in Th17 cells (Fig. 3A). To confirm these results, we detected the expression of these proteins using western blotting analysis, and found a similar trend (Fig. 3B). Moreover, the mRNA expression of these proteins presented the same pattern (Fig. 3C), indicating that glutamate is critical for Treg cell function.
Fig. 3
Expression analysis of glutamine metabolic pathway enzymes. A) MS intensity of enzymes in glutamine metabolic pathway. B) Western blotting analysis of enzymes in glutamine metabolic pathway. (a) WB images of each target protein, (b) Quantification analysis of each protein. Each experiment was repeated three times independently. **p < 0.01, ***p < 0.001, ****p < 0.0001 compared with control group C) qPCR analysis of enzymes in glutamine metabolic pathway. Each experiment was repeated three times independently. **p < 0.01, ***p < 0.001 compared with control group
Detection of glutamate-related metabolites in T cells
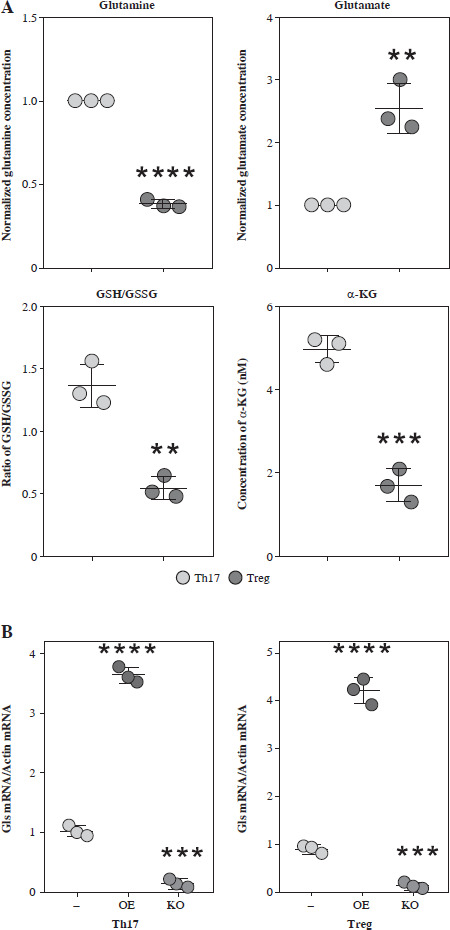
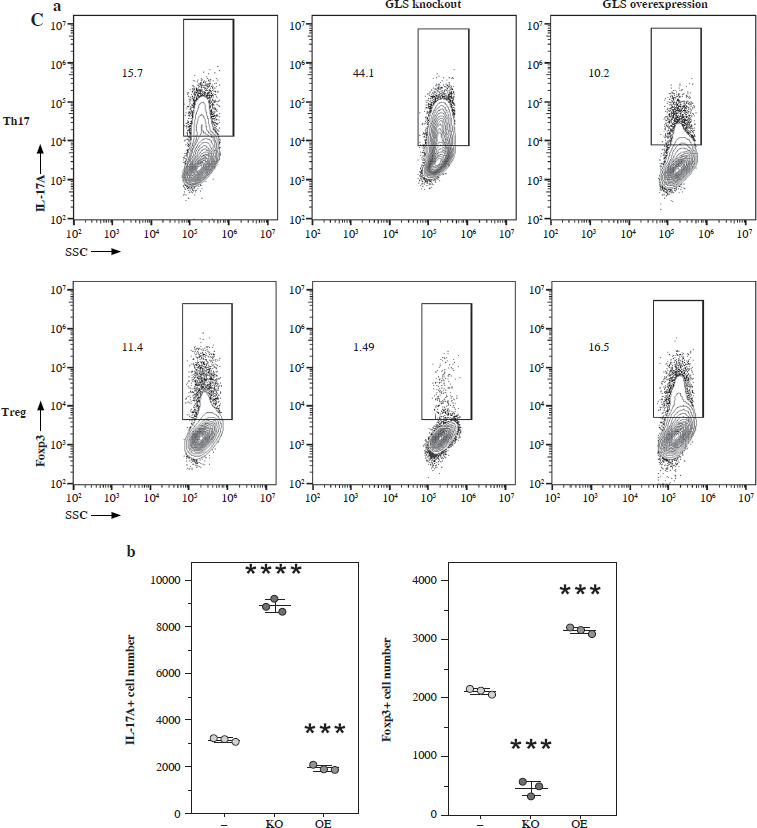
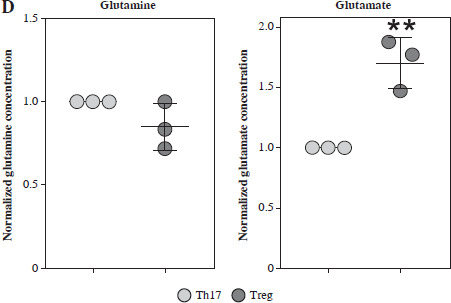
To further confirm the function of glutamate-related metabolites, we cultured the Th17 and Treg cells under different supplementation of glutamine, glutamate, GSH and α-KG. The normalized concentration of glutamine, ratio of GSH/GSSG, and α-KG were significantly increased in the culture medium of Th17 (Fig. 4A). To confirm the function of GLS in Th17 and Treg cell generation, we constructed a GLS knockout and overexpression model in Th17 and Treg cells. Using qPCR, we confirmed the successful construction of these models (Fig. 4B). Further knockout of GLS expression significantly promotes Th17 generation but suppresses Treg generation, and overexpression of GLS suppresses Th17 generation but promotes Treg generation (Fig. 4C). The normalized concentrations of glutamine and glutamate in the culture medium of GLS knockout model of Th17 and Treg cells presented a trend similar to that of the non-knockout group, but the differences were limited (Fig. 4D).
Fig. 4
Concentration of glutamine-related metabolites in Th17 and Treg cells. A) Normalized concentration of glutamine, glutamate, GSH/GSSG and α-KG in culture medium of Th17 and Treg cells. B) Detection of Gls gene expression in Gls knockout and overexpression model of Th17 and Treg cells. Each experiment was repeated three times independently. **p < 0.01, ***p < 0.001, ****p < 0.0001 compared with control group C) Knockout and overexpression of GLS in Th17 and Treg cells. (a) FACS analysis of Th17 and Treg cells, (b) Cell number of IL-17A+ and Foxp3+ cells. Each experiment was repeated three times independently. **p < 0.01, ***p < 0.001, ****p < 0.0001 compared with control group
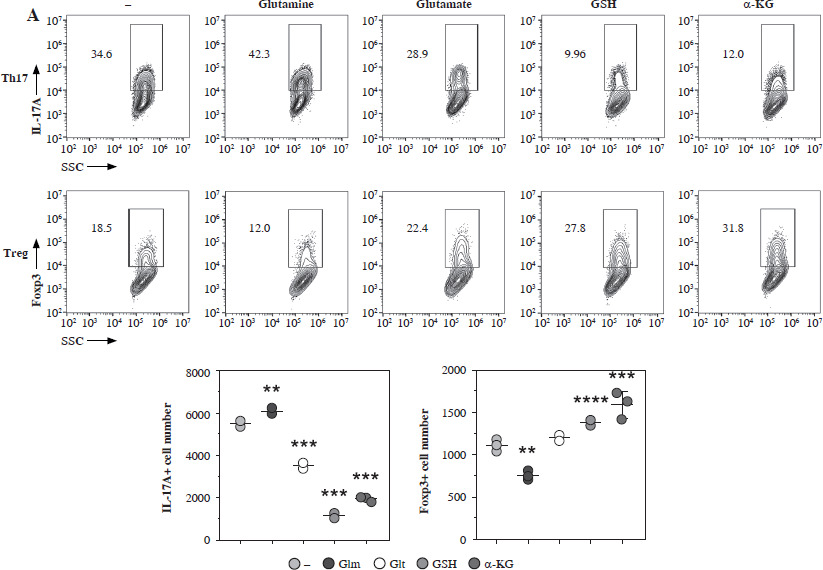
Effect of glutamate metabolites on differentiation of Th17 and Treg cells
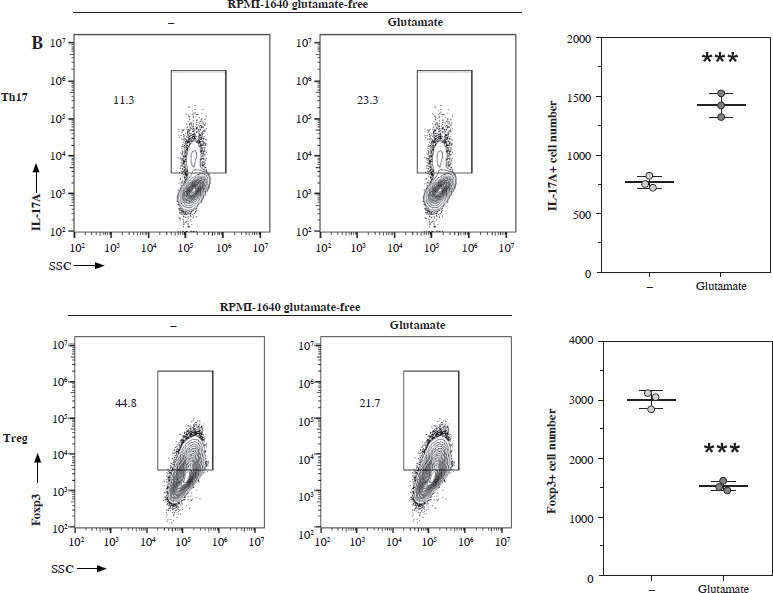
Next, we added the different metabolites of glutamate to the culture medium of Th17 and Treg cells. We found that glutamine significantly promoted the generation of Th17 while suppressing the generation of Treg; however, glutamate, GSH, and α-KG showed a reverse trend (Fig. 5A). We tested this hypothesis in a glutamate-free medium, and found that generation of Th17 was impaired in the glutamate-free medium, but Treg cell generation was high, and after glutamate supplementation, Th17 generation was promoted while Treg generation was suppressed (Fig. 5B).
Discussion
Th17 cells and Treg cells were both induced by the signaling pathway mediated by TGF-β. With the presence of IL-6 or IL-21, naïve T cells can differentiate into Th17 cells; however, without the presence of pro-inflammatory cytokines, naïve T cells differentiate into Treg cells [13]. Th17 cells secrete IL-17, IL-22, and IL-23, exhibiting an inflammation-promoting function. In contrast, Treg cells secrete IL-10 and TGF-β, exhibiting an inflammation-inhibiting function [14]. Therefore, Th17/Treg cell imbalance is a major source of autoimmune diseases, including inflammatory bowel disease (IBD), rheumatoid arthritis (RA), and multiple sclerosis (MS) [15]. Here, we used MS analysis of cellular proteins from Th17 and Treg cells as well as the culture medium of these cells, and analyzed the expression of differentially expressed proteins. Further bioinformation analysis of these proteins revealed that the metabolism of glutamine was significantly altered; hence, we hypothesized that glutamine metabolism might regulates the Th17/Treg cell balance.
In the effector T cells, the metabolism of glucose is highly increased. Additionally, the uptake of glutamine and glutaminolysis is up-regulated [7]. Glutamine is one of the essential amino acids in cells, especially for rapidly proliferating cells, and activated T cells mainly highly expressed amino acid transporters and enzymes of glutamine [6]. Glutamine can be converted into glutamate by glutaminase (GLS), and can further be used for protein synthesis and generation of glutathione to maintain reactive oxygen species (ROS) homeostasis and promote cystine uptake [16]. Glutamate can further be converted into α-ketoglutarate (α-KG), providing the anaplerotic support of the tricarboxylic acid cycle (TCA) cycle, histone and DNA demethylases, as well as chromatin accessibility [11]. To confirm the effect of metabolites in glutamine metabolism on Th17/Treg balance, we detected the expression of enzymes in glutamine metabolism, and found that the expression of these enzymes was significantly altered.
A previous study showed that glutamine restriction promotes the development of memory T cells, and this effect can be abolished by α-ketoglutaric acid, indicating that glutamine restriction might enhance the function of CD8 T cells [17]. Another study showed that knockout of GOT1 expression limits Th17 cell generation but promotes Treg cell generation, and this effect is mediated by the glutamate-α-KG-2-HG axis and the phosphorylation of AMPK pathways [18]. GOT1/2 (glutamate oxaloacetate transaminases 1 and 2) catalyze glutamate conversion to α-KG, and further catalysis to 2-HG by isocitrate dehydrogenase. A high 2-HG level leads to methylation of the CpG islands of Foxp3, suppressing Treg generation [18].
GLS catalyzes conversion of glutamine to glutamate, and the activity of GLS increases with the activation of T cells by anti-CD3 and anti-CD28 antibodies [19]. GLS deficiency limits the activation and proliferation of T cells, and leads to the expression of T-bet and further differentiation into Th1 cells [20]. Aside from activation of effector T cells, glutamine metabolism is also implicated in different T cell subsets. Glutamine deprivation was proved to promote the expression of Foxp3, a specific transcriptional regulator for regulatory T cells [7]. Inhibition of glutamic-oxaloacetate transaminase 1 (GOT1), an enzyme catalyzing the conversion of glutamate to α-KG, leads to the differentiation of Th17 to Treg cells through methylation of the Foxp3 locus [21]. Although glutamine metabolism is closely related to the generation of Th17 and Treg cells, the role of GLS in this process is not clear.
GLS is the first enzyme in the glutaminolysis pathway, and regulates multiple biological processes. A previous study showed up-regulation of GLS in tumor cells, which promotes tumorigenesis [22]. Recent research showed that GLS expression is critical for Th17 cell differentiation, and inhibition or deletion of GLS leads to amelioration of disease development [23]. GLS expression also related to the severity of systemic lupus erythematosus (SLE) in patients through regulation of ROS in the T cell fate decision process [24]. Here, we found that GLS is specifically expressed in Treg cells, but not in Th17 cells, and may be a critical regulator of Treg cell function. Genetic deletion of GLS or supplementation of downstream metabolites of glutamine confirmed that glutamine metabolism suppressed Treg cell generation, but promoted Th17 cell generation.
To further confirm these hypotheses, we cultured the Th17 and Treg cells with additional supplementation of glutamine metabolites, and found that these metabolites reduced IL-17A expression but increased Foxp3 expression. Using glutamate-free medium, we obtained similar results. Hence, we concluded that glutamate metabolism regulated by GLS may be a potential target for treatment of autoimmune diseases.