Introduction
Tuberculosis (TB), caused by Mycobacterium tuberculosis, is a chronic infectious disease that primarily affects the lungs [1]. It is a leading cause of death worldwide, accounting for more than 1.4 million deaths annually [2]. Approximately 95% of primary M. tuberculosis infections are asymptomatic, progressing to latent infections, while 5-10% develop into active disease [3]. Established risk factors for active TB include human immunodeficiency virus (HIV) infection, malnutrition, and young age [4]. Patients with active TB may be afflicted with symptoms such as coughing, chest pain, weight loss, fever, and fatigue [5]. Conventional bacteriological tests, despite being the gold standard, have a low positivity rate of approximately 30% [6]. Isoniazid and rifampicin are employed as the first-line anti-TB drugs [7]. However, the nonadherence of patients to anti-tubercular drugs leads to the development of multidrug resistance, resulting in treatment challenges [8]. Thus, novel diagnostic biomarkers and therapeutic strategies for TB are urgently needed.
The immune response to M. tuberculosis is critical in regulating TB initiation, progression, and outcomes [9]. Immune activation and inflammatory response are essential for host protection against mycobacteria, while dysregulated responses can exacerbate the disease [10]. Antigen-specific CD4+ T cells are central to adaptive immunity against M. tuberculosis, with T helper cell 1 (Th1) and Th17 as key effector subsets [11]. Th1 cells produce interferon γ (IFN-γ) and mediate protection mainly by activating macrophages which destroy intracellular pathogens [12]. The main effector cytokine of Th17 cells is interleukin (IL)-17, which can eliminate the primary infection and establish an effective memory response [13].
Glutaminolysis is a metabolic process that produces various substrates for anabolism in effector T cells. In this process, glutamine is lysed to glutamate, which later converts to α-ketoglutarate that then enters the tricarboxylic acid (TCA) cycle and generates multiple metabolites such as acetyl-CoA [14]. This metabolic pathway provides energy for T cell activation by regulating multiple enzymatic activities [15, 16]. Glutaminase 1 (GLS1), the rate-limiting enzyme in glutaminolysis, converts glutamine to glutamate [17]. Evidence suggests that GLS1-mediated glutaminolysis can enhance Th17 cell generation and promote psoriasis pathogenesis in mice [18]. Additionally, GLS1 inhibition by BPTES can normalize the effector functions of Th17 and Th1 cells and alleviate Sjögren’s syndrome [19]. Moreover, Zhang et al. reported that GLS1 inhibition affects the Th1/Th2 and Th17/Treg imbalance in lupus models [16]. However, the role of GLS1 in TB pathogenesis remains underexplored.
This study aimed to investigate the role and potential mechanism of GLS1 in Th1/Th17 cell differentiation. We hypothesized that GLS1-mediated glutaminolysis may regulate TB progression by modulating Th1 and Th17 immune responses.
Material and methods
Sample collection
Peripheral blood was collected from 30 TB patients and 30 healthy donors at Houjie Hospital of Dongguan. TB patients were diagnosed according to clinical manifestations, bacteriological identification, and genotyping. TB patients aged 18-64 years with a smear-positive result for acid-fast bacilli or a GeneXpert MTB/RIF positive result were enrolled in our study. The exclusion criteria included: 1) requirement for hospital admission, 2) pregnancy, 3) diagnosis of multidrug-resistant or extensively drug-resistant TB, 4) HIV infection, 5) other concurrent infectious diseases. Healthy volunteers undergoing annual health check-ups during the same period were recruited. The inclusion criteria included: 1) normal chest X-ray, 2) no recent TB patient contact, 3) negative purified protein derivative test, and 4) no history of immunosuppressive drug use, autoimmune diseases, acquired immunodeficiency, hypertension, diabetes, hepatitis, or tumors. TB patients and healthy controls were matched for age and gender, with no significant differences. Written informed consent was obtained from each participant. This study was approved by the Ethics Committee of Houjie Hospital of Dongguan (approval No. 2022-007; March 22, 2022).
Isolation of peripheral blood mononuclear cells
Peripheral blood mononuclear cells (PBMCs) were isolated through Ficoll-Hypaque density gradient centrifugation with Lymphoprep solution (Stemcell Technologies, Shanghai, China). The buffy coat layer (containing PBMCs) at the interface between the plasma and Ficoll-Hypaque was gently aspirated using a pipette and transferred to a new 15 ml sterile conical tube, followed by washing twice with phosphate-buffered saline (PBS). The isolated PBMCs (2.5 × 10⁶ cells/ml) were resuspended in RPMI-1640 culture medium containing 10% fetal bovine serum and 1% penicillin/streptomycin (Yeasen, Shanghai, China) in a humidified 5% CO2 atmosphere at 37°C.
Cell sorting
For CD4+ T cell isolation, freshly isolated PBMCs were incubated with anti-human CD4 microbeads (NovoBiotechnology Co., Ltd, Beijing, China) for 15 min at 4°C, followed by passing through the magnetic bead separation column to retain labeled CD4+ cells. After the removal of the column, CD4+ cells were eluted and collected. Similarly, CD14+ monocytes were sorted by incubating PBMCs with anti-human CD14 microbeads before magnetic separation. The purities of CD4+ T cells and CD14 monocytes were determined by flow cytometry using FITC-CD3 (1 : 100, clone UCHT1, ab34275), PE-CD4 (1 : 200, clone MEM-241, ab18282), and FITC-CD14 (1 : 100, clone MEM-15, ab28061) antibodies (all from Abcam, Shanghai, China). Mouse IgG1-FITC (clone B11/6, ab91356, Abcam) or IgG1-PE (clone B11/6, ab91357, Abcam) was used as an isotype control to exclude the interference of fluorescein.
Cell culture
Mycobacterium tuberculosis strain H37Rv (ATCC, Manassas, VA, USA) was cultured in Middlebrook 7H9 broth medium (Thermo Fisher, Shanghai, China) supplemented with 10% oleic acid albumin dextrose catalase enrichment (OADC; Thermo Fisher) at 37°C for three weeks. Bacterial cells were harvested by centrifugation, resuspended in PBS, and lysed by ultrasonication. To stimulate immune responses, PBMCs were incubated with H37Rv whole cell lysate (10 µg/ml) for 48 hours. To investigate the role of GLS1-mediated glutaminolysis, PBMCs were treated with 10 µM BPTES (a GLS1 inhibitor; MedChemExpress, Shanghai, China) and 1 mM glutamate (Sigma-Aldrich, St. Louis, MO, USA).
Flow cytometry analysis
After the indicated treatments, PBMCs were harvested and washed twice with PBS. Cells were resuspended in the staining buffer and stained with FITC-conjugated anti-CD4 antibody (1 : 1000, clone B-A1, ab59474, Abcam). The isotype control was Mouse IgG1 (clone B11/6, ab91356, Abcam) at the same dilution. For intracellular cytokine detection, cells were stained with PE-conjugated anti-IFN-γ (1 : 200, clone BYGAMMA3-11.1, AC0799, Beyotime, Shanghai, China) or anti-IL-17 (clone BYBL23, 1 : 200, AC0804, Beyotime) antibodies. Corresponding isotype controls for intracellular staining were Mouse IgG1 (clone B11/6, ab91357, Abcam) for both IFN-γ and IL-17A antibodies, used at matching dilutions to assess non-specific binding. The stained cells were washed twice and analyzed on a FACSCalibur flow cytometer (BD Biosciences, Beijing, China), and the data were analyzed using FlowJo software.
Enzyme-linked immunosorbent assay
Culture supernatants from PBMCs were collected after the indicated treatments. Concentrations of IFN-γ and IL-17 were determined by commercially available enzyme-linked immunosorbent assay (ELISA) kits (Nanjing Jiancheng Bioengineering Institute, Nanjing, China) as per the manufacturer’s instructions.
Measurement of ATP production
The concentration of intracellular ATP was determined using an ATP Assay Kit (S0026, Beyotime) according to the manufacturer’s instructions. Briefly, PBMCs were lysed to isolate total protein and then centrifuged at 12,000 g and 4°C for 5 minutes. Next, 20 µl of the sample or standard solution was added to 100 µl of ATP detection solution, mixed, and luminescence was measured with a luminometer (Promega, Madison, WI, USA).
Assessment of OCR and ECAR
Cells were incubated with an oxygen consumption rate (OCR; ab197243, Abcam) or extracellular acidification rate (ECAR; ab197244, Abcam) reagent as recommended by the manufacturer. After incubation according to the instructions, a microplate reader (Thermo Scientific) was used to record the final assay signals at 10 minutes intervals for approximately 120 minutes, employing excitation and emission wavelengths of 380 and 650/615 nm, respectively.
RT-qPCR
Total RNA was extracted from PBMCs or CD4+ T cells using TRIzol reagent (Sigma-Aldrich). RNA concentration and purity were assessed at 260 nm/280 nm using a NanoDrop Spectrophotometer (Thermo Fisher). Total RNA (1 µg) was reverse transcribed into cDNA using the PrimeScript RT reagent kit (Takara, Beijing, China). RT-qPCR was performed via the TaqMan Gene Expression Assays Protocol (Thermo Fisher). Relative gene expression was calculated using the 2-ΔΔCt method [20], normalized to GAPDH. Primer sequences are listed in Table 1.
Table 1
Sequences of primers used for RT-qPCR
Western blotting
Total protein was extracted from PBMCs or CD4+ T cells using RIPA lysis buffer (Beyotime) supplemented with 1% phenylmethylsulfonyl fluoride (PMSF) and a protease inhibitor cocktail (Beyotime). Equal amounts of protein samples (40 µg) were separated by electrophoresis on 10% sodium dodecyl sulfate-polyacrylamide gel electrophoresis and transferred onto polyvinylidene fluoride membranes (Beyotime). Subsequently, the membranes were blocked with 5% skimmed milk for 1 hour at room temperature and incubated overnight at 4°C with primary antibodies against GLS1 (1 : 1000, clone EP7212, ab156876), GAPDH (1 : 2500, ab9485), H3K9ac (1 : 500, clone Y28, ab32129), H3K14ac (1 : 2000, clone EP964Y, ab52946), H3K23ac (1 : 1000, clone EPR17712, ab177275), H3K27ac (1 : 2500, ab4729), and total H3 (1 : 1000, ab1791) (all from Abcam). After washing three times with Tris Buffered Saline Tween 20 (TBST) three times, the membranes were incubated with horseradish peroxidase-conjugated goat anti-rabbit IgG secondary antibody (1 : 3000, ab6721, Abcam) at room temperature for 1 hour. Finally, the membranes were washed three times in TBST, and protein bands were visualized with an enhanced chemiluminescence reagent (Thermo Fisher). Band intensities were quantified using Image J software.
Colony-forming unit (CFU) assays
To induce macrophage differentiation, the isolated CD14+ monocytes were incubated in RPMI-1640 medium supplemented with 10% FBS and 50 ng/ml recombinant human macrophage colony-stimulating factor (P5313, Beyotime) for 7 days. The medium was refreshed every 2 days. Differentiated macrophages were infected with H37Rv at a multiplicity of infection (MOI) of 5 : 1 (bacteria : macrophage) for 4 hours at 37°C, followed by washing with PBS to remove extracellular bacteria. Then, infected macrophages were treated with 10 µM BPTES or 1 mM glutamate for 48 hours. To evaluate intracellular bacterial survival, macrophages were lysed with 0.1% Triton X-100 for 10 minutes. Cell lysates were serially diluted (10-fold) in PBS, and the dilutions were plated on Middlebrook 7H10 agar plates (Solarbio, Beijing, China). The plates were incubated at 37°C for 3 weeks, and then the colonies were quantified manually.
Induction of Th1 and Th17 cell differentiation
CD4+ T cells isolated from healthy controls were stimulated with plate-bound anti-human CD3 (5 µg/ml) and anti-human CD28 (1 µg/ml) antibodies for 5 days under different induction conditions. To induce Th1 differentiation, IL-12 (10 ng/ml) and IL-4 (10 µg/ml) were added. To induce Th17 differentiation, transforming growth factor β (TGF-β; 5 ng/ml), IL-6 (20 ng/ml), IL-1β (10 ng/ml), IL-23 (20 ng/ml), anti-IFN-γ (10 µg/ml), and anti-IL-4 (10 µg/ml) were added. All the antibodies were obtained from Abcam. Cell culturing was performed in 48-well plates with a total volume of 0.5 ml/well culture medium with 2.5 × 10⁵ CD4+ T cells. The medium was refreshed on day 3.
Measurement of acetyl-CoA
Th1/Th17 cells were lysed and centrifuged at 20,000 g for 10 minutes at 4°C. Then, the pellets were discarded, and the supernatant was collected. The concentration of acetyl-CoA in the supernatant was determined using an acetyl-CoA Assay kit (MAK039, Sigma-Aldrich) according to the manufacturer’s protocols.
Chromatin immunoprecipitation assay
The cells were cross-linked with 1% formaldehyde, and the reaction was quenched with 125 mM glycine. Cells were lysed, and nuclei were isolated using a chromatin immunoprecipitation (ChIP) assay kit (P2078, Beyotime) following the manufacturer’s instructions. Chromatin was sonicated to fragments of 200-500 bp. Then, 50 µl of sonicated chromatin was immunoprecipitated overnight with 2 µg of anti-H3K27ac (ab4729, Abcam) or anti-H3K9ac (ab32129, Abcam) antibodies. Beads with bound immunocomplexes were washed and eluted, followed by DNA isolation to perform RT-qPCR. Input DNA (10% of sonicated chromatin) was used as a reference, and results were expressed as percentage of input.
Statistical analysis
Statistical analysis was performed using GraphPad Prism 8 (GraphPad Software, San Diego, CA, USA). Data are presented as the mean ± standard deviation. Differences between two groups were evaluated using Student’s t-test, while those among multiple groups were assessed using one-way analysis of variance followed by Tukey’s post hoc test. Statistical significance was set at p < 0.05.
Results
GLS1 is upregulated in PBMC-derived CD4+ T cells of TB patients
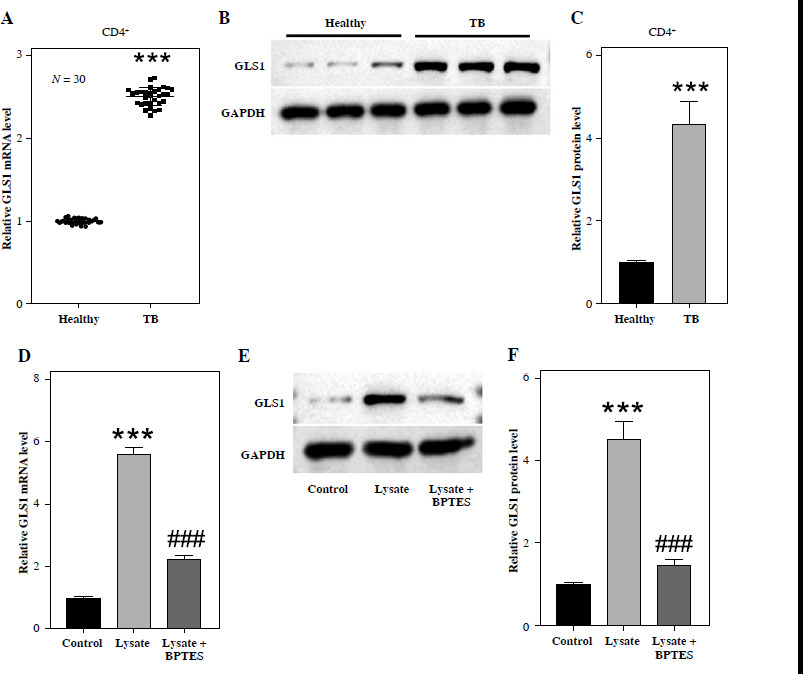
First, we evaluated the expression of GLS1 in CD4+ T cells sorted from PBMCs of TB patients and healthy volunteers. Flow cytometry showed that the purity of isolated CD4+ T cells was > 95% (Supplementary Fig. 1A). As RT-qPCR and western blotting demonstrated, TB patients exhibited significantly higher GLS1 mRNA and protein levels in CD4+ T cells compared to healthy controls (Fig. 1A-C). Additionally, no significant difference was found in GLS2 expression between the two groups (Supplementary Fig. 1B). Then, PBMCs were stimulated with M. tuberculosis strain H37Rv lysate. Notably, GLS1 expression was upregulated after H37Rv lysate stimulation in PBMCs from healthy donors and TB patients (Supplementary Fig. 1C). Compared with those from healthy donors, PBMCs derived from TB patients had higher levels of GLS1 in both the control and stimulated groups (Supplementary Fig. 1C). We then selected PBMCs from healthy donors for further experiments. Moreover, treatment with BPTES, a GLS1 inhibitor, effectively inhibited GLS1 activity in H37Rv lysate-stimulated PBMCs (Fig. 1D-F).
Fig. 1
Glutaminase 1 (GLS1) is upregulated in PBMC-derived CD4+ T cells of TB patients. A) The mRNA level of GLS1 in CD4+ T cells derived from PBMCs of TB patients and healthy donors was measured by RT-qPCR (n = 30). B, C) The protein level of GLS1 in CD4+ T cells derived from PBMCs of TB patients and healthy donors was evaluated by western blotting (n = 30). D) The mRNA level of GLS1 in healthy PBMCs treated with or without H37Rv lysate and BPTES (a GLS1 inhibitor) was measured by RT-qPCR. E, F) The protein level of GLS1 in healthy PBMCs under different treatments was measured by western blotting. n = 3/group. ***p < 0.001 vs. healthy group or control group, ###p < 0.001 vs. lysate group
GLS1-mediated glutaminolysis promotes Th1/Th17 cell differentiation
Then, the effect of GLS1 on Th1/Th17 cell differentiation was examined. As flow cytometry revealed, M. tuberculosis H37Rv lysate stimulation significantly promoted Th1 and Th17 cell differentiation, as evidenced by higher frequencies of CD4+IFN-γ+ and CD4+IL-17+ cells compared to the control group. However, the inhibition of glutaminolysis by BPTES significantly reduced the proportions of CD4+IFN-γ+ and CD4+IL-17+ cells, which were recovered by supplementation of glutamate (Fig. 2A-D). Moreover, we found that ATP production was increased in PBMCs stimulated with H37Rv lysate, indicating increased metabolic activity. Treatment with BPTES reduced ATP levels, while glutamate supplementation partially restored this effect caused by BPTES (Fig. 2E).
Fig. 2
Glutaminase 1 (GLS1)-mediated glutaminolysis promotes Th1 and Th17 cell differentiation. A, B) Flow cytometry analysis for the proportion of CD4+IFN-γ+ Th1 cells. C, D) Flow cytometry analysis for the proportion of CD4+IL-17+ Th17 cells.
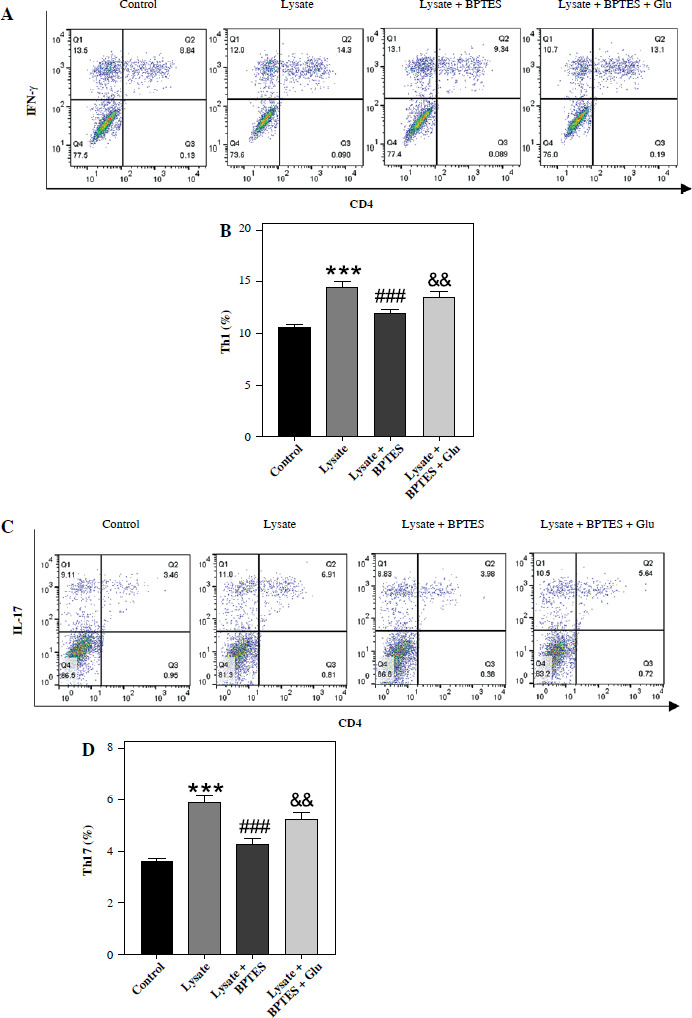
Fig. 2. Cont.
E) Measurement of ATP production in PBMCs under different treatments. F) Evaluation of basal OCR. G) Evaluation of ECAR. n = 3/group. ***p < 0.001 vs. control group, ###p < 0.001 vs. lysate group, &&p < 0.01, &&&p < 0.001 vs. lysate + BPTES group
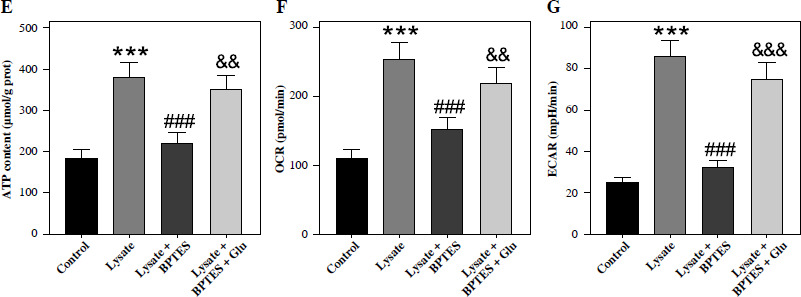
In addition, basal OCR and ECAR were measured to further evaluate the metabolic fitness of PBMCs. As shown in Figure 2F, G, lysate stimulation increased OCR and ECAR, which was partially counteracted by BPTES treatment. Addition of glutamate rescued BPTES-mediated reduction in OCR and ECAR under H37Rv lysate stimulation. These results indicate the critical role of GLS1-mediated glutaminolysis in Th1/Th17 differentiation and metabolic fitness during M. tuberculosis antigen stimulation.
Inhibition of GLS1 by BPTES protects M. tuberculosis survival in macrophages
Moreover, we determined the levels of cytokines secreted by Th1/Th17 cells. As demonstrated by ELISA, the concentrations of IFN-γ and IL-17 were higher in H37Rv lysate-stimulated PBMCs compared with the unstimulated cells. BPTES reduced IFN-γ and IL-17 levels in H37Rv lysate-stimulated PBMCs, while this effect was reversed by glutamate supplementation (Fig. 3A, B). Consistent results were observed in RT-qPCR analysis showing changes in IFN-γ and IL-17 mRNA levels in each group (Fig. 3C, D). Then, PBMC-derived CD14+ monocytes (purity > 95%, as shown in Supplementary Fig. 1D) were differentiated into macrophages, followed by H37Rv infection.
Fig. 3
Inhibition of glutaminase 1 (GLS1) by BPTES facilitates M. tuberculosis survival in macrophages. A, B) ELISA for determining the concentrations of IFN-γ and IL-17 in PBMCs. C, D) RT-qPCR analysis of IFN-γ and IL-17 mRNA levels. E, F) M. tuberculosis survival in macrophages was measured using the colony-forming unit (CFU) assay. n = 3/group. ***p < 0.001 vs. control group or H37Rv group, ##p < 0.01, ###p < 0.001 vs. lysate group or H37Rv + BPTES group, &&&p < 0.001 vs. lysate + BPTES group
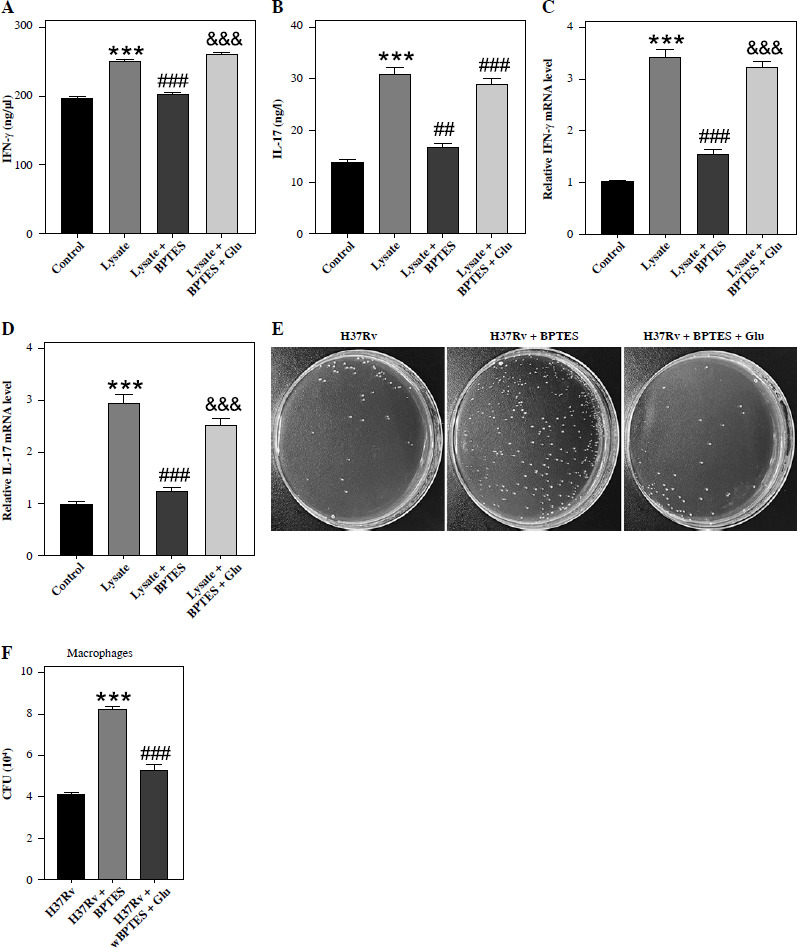
CFU assays demonstrated that BPTES treatment markedly increased the survival of M. tuberculosis from infected macrophages, whereas supplementation of glutamate significantly abolished the effect of BPTES (Fig. 3E, F).
GLS1-mediated glutaminolysis promotes H3K9ac and H3K27ac epigenetic modification in the IFN-γ or IL-17 gene promoters
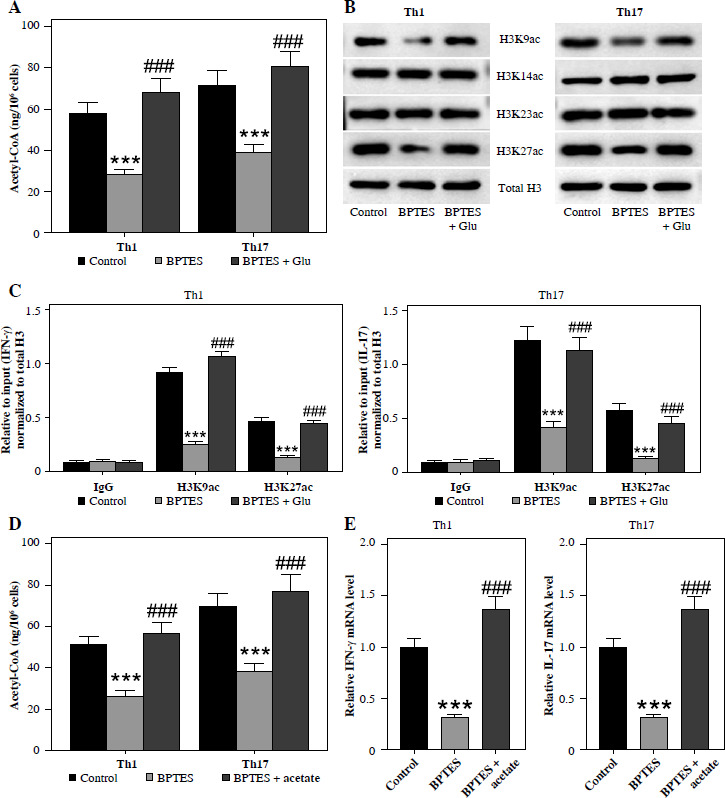
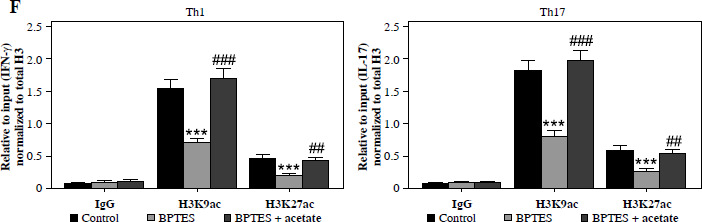
We then explored the regulatory mechanisms by which GLS1-mediated glutaminolysis modulates Th1/Th17 cell differentiation. We assessed the acetyl-CoA concentration in Th1 and Th17 cells. Treatment with BPTES significantly reduced acetyl-CoA production, which was rescued by supplementation of glutamate (Fig. 4A). To investigate the link between GLS1-mediated glutaminolysis and histone acetylation, we assessed histone acetylation levels (H3K9ac, H3K14ac, H3K23ac, and H3K27ac) in Th1/Th17 cells using western blotting. BPTES treatment markedly reduced H3K9ac and H3K27ac levels compared to the control group, whereas this effect was rescued by glutamate supplementation in Th1 cells (Fig. 4B). Similar results were observed in Th17 cells (Fig. 4B). Additionally, no significant difference was observed in H3K14ac or H3K23ac among these groups (Fig. 4B). ChIP assays revealed that BPTES treatment significantly reduced H3K9ac and H3K27ac enrichment at the IFN-γ and IL-17 gene promoters, while supplementation of glutamate restored these epigenetic marks (Fig. 4C). Furthermore, we evaluated the role of acetate, a key nutrient contributing to acetyl-CoA synthesis. We found that acetate supplementation counteracted BPTES-mediated suppression of acetyl-CoA production and restored IFN-γ and IL-17 expression levels in Th1 and Th17 cells, respectively (Fig. 4D, E). Additionally, acetate addition abolished BPTES-mediated reduction in H3K9ac and H3K27ac enrichment at the promoter region of IFN-γ and IL-17 (Fig. 4F). The above results indicate that GLS1-mediated glutaminolysis regulates Th1 and Th17 cell differentiation by modulating histone acetylation at key gene promoters.
Fig. 4
Glutaminase 1 (GLS1)-mediated glutaminolysis affects Th1/Th17 cell differentiation via histone acetylation. A) Measurement of acetyl-CoA concentrations in Th1 and Th17 cells in the control, BPTES, and BPTES + glutamate groups. B) The levels of H3K9ac, H3K14ac, H3K23ac, and H3K27ac in Th1 and Th17 cells were evaluated by western blotting. C) ChIP assays for detecting H3K9ac and H3K27ac enrichment at the promoter region of IFN-γ or IL-17. D) Measurement of acetyl-CoA concentrations in Th1 and Th17 cells in the control, BPTES, and BPTES + acetate groups. E) RT-qPCR of IFN-γ and IL-17 mRNA levels in Th1 or Th17 cells, respectively. ***p < 0.001 vs. control group, ##p < 0.01, ###p < 0.001 vs. BPTES group
Discussion
The present study demonstrated that GLS1 was upregulated in T cells from TB patients. BPTES, a GLS1 inhibitor, suppressed M. tuberculosis H37Rv lysate-stimulated Th1 and Th17 differentiation in PBMCs. Moreover, BPTES increased M. tuberculosis survival in infected macrophages. Additionally, glutamate supplementation could reverse these effects mediated by BPTES. Mechanistically, GLS1 inhibition suppressed acetyl-CoA-dependent histone acetylation at the IFN-γ and IL-17 promoters.
Macrophages, the primary host cells for M. tuberculosis, serve as the first line of defense against respiratory pathogens [21]. Macrophage phagocytosis of M. tuberculosis initiates granuloma formation, which can sequester the bacteria but also provides a niche for their persistence and reactivation [22]. M. tuberculosis has evolved mechanisms to survive and replicate within macrophages, thus escaping the body’s immune system [23]. Glutamine is the main nitrogen source for M. tuberculosis [24]. Previous evidence has indicated that mycobacterium can modulate macrophage autophagy to enhance intracellular survival by manipulating GLS1-mediated glutaminolysis [25]. Consistent with this, we found that BPTES significantly increased M. tuberculosis survival in infected macrophages, whereas glutamate supplementation reversed this effect, indicating the critical role of GLS1-mediated glutaminolysis macrophage function.
Emerging evidence indicates that the immune response against M. tuberculosis infection depends on the activation of CD4+ T cells, with Th1 and Th17 cells as critical effector subsets [26]. IFN-γ-producing Th1 cells defend against TB by activating macrophages and stimulating phagocytosis, phagosome maturation, and antigen presentation [27]. A strong IFN-γ-mediated Th1 immune response is considered the primary protective mechanism of anti-TB immunity [28]. Additionally, elevated plasma levels of IFN-γ have been observed in TB patients, and depressed IFN-γ production in diabetic patients is related to a decreasing immune response to M. tuberculosis infection [29]. However, an IFN-γ response is not an optimal correlation of protection, because IFN-γ alone is insufficient to control M. tuberculosis infection [30]. Th17 cells are a unique subset of effector T cells that are distinct from the Th1 and Th2 subsets [31]. They also play a key role in immunity against TB, with IL-17 as the main effector cytokine. CD4+IL-17+ T-cells play a particularly crucial role in vaccine-mediated immunity via prompt recruitment to the lungs, leading to early control of M. tuberculosis replication in infected mice [32]. A reduced Th17 response has been associated with severe outcomes of M. tuberculosis infection [33]. Ritter et al. reported that IL-17A-deficient mice exhibited high susceptibility to M. tuberculosis infection due to the strong accumulation of neutrophils in the infected lung tissue [34]. A previous study revealed that IFN-γ production was elevated in PBMCs stimulated with M. tuberculosis lysate [35]. Consistently, our study showed that the proportion of CD4+IFN-γ+ T cells and the expression levels of IFN-γ were significantly elevated in M. tuberculosis strain H37Rv lysate-stimulated PBMCs. Additionally, the lysate also induced increases in CD4+IL-17+ T cell proportion and IL-17 expression, indicating that the antigen stimulation induces immune responses of Th1 and Th17 cells.
The conversion of glutamine to glutamate catalyzed by GLS1 is critical during the differentiation of CD4+ T cells [36]. It has been reported that both GLS1 shRNA and its selective inhibitor BPTES restrain Th17 differentiation [37]. Johnson et al. demonstrated that GLS inhibition reduced cytokine production in Th17 cells and increased Th1 cell numbers, which exhibited functional exhaustion over time [38]. A previous study also demonstrated that BPTES divergently inhibited IFN-γ-producing cells in the infiltrated CD4+ T cell population [19]. Moreover, evidence suggests that cellular glutamine metabolism is involved in effective host responses against M. tuberculosis [39]. However, it is unclear whether GLS1-mediated glutamine metabolism affects Th1/Th17 differentiation in TB. Herein, GLS1 inhibition by BPTES led to reduction in Th1/Th17 proportions and cytokine expression, suggesting that glutaminolysis is a key metabolic checkpoint for Th1/Th17 responses. Targeting GLS1 with inhibitors such as BPTES could modulate excessive Th1/Th17-driven inflammation, potentially reducing tissue damage in severe TB. Additionally, BPTES reduced ATP production, OCR, and ECAR in M. tuberculosis lysate-stimulated PBMCs, reflecting impaired mitochondrial and glycolytic metabolism, which are critical for T cell proliferation and cytokine production. These effects caused by BPTES were partially reversed by glutamate supplementation, indicating the role of downstream glutamine metabolites.
Glutaminolysis provides α-ketoglutarate to fuel the TCA cycle, generating acetyl-CoA for energy and epigenetic modifications [40]. Consistently, our study revealed that the acetyl-CoA concentration was reduced following BPTES treatment. Studies have suggested that aberrant epigenetic modifications are involved in the pathogenesis of TB [41-43]. This study showed that BPTES led to a decrease in H3K9ac and H3K27ac at IFN-γ and IL-17 promoters in Th1 and Th17 cells, respectively, suggesting that GLS1-mediated acetyl-CoA production supports histone acetylation, thereby enhancing gene transcription. Additionally, our analysis was limited to promoter regions, and the genome-wide distribution of these histone modifications and their roles in enhancer regions remain unexplored. Future studies are needed to employ ChIP-seq to systematically map epigenetic marks (H3K9ac, H3K27ac, H3K4me1, and H3K4me3) in Th1 and Th17 cells under GLS1 inhibition.
In conclusion, this study demonstrated that GLS1-mediated glutaminolysis regulates TB progression by modulating Th1 and Th17 immune responses via acetyl-CoA-dependent epigenetic regulation. These findings highlight the role of GLS1 in TB immune imbalance and identify it as a potential therapeutic target for modulating host immunity in TB.