Introduction
Uterine corpus endometrial carcinoma (UCEC) is one of the most common gynecologic malignant tumors [1]. In China, approx. 80,000 new cases of UCEC were recorded in 2020 [2]. In the United States, the incidence of UCEC was approx. 65,950 new cases in 2022, thus resulting in 12,550 fatalities attributed to this malignancy [3]. Therefore, the precise mechanism underlying the tumorigenicity of UCEC should be elucidated to provide novel therapeutic strategies in clinical practice.
Microfibril-associated protein 2 (MFAP2), a component of extracellular matrix microfibrils, is involved in several pathophysiological processes, including elastic fiber assembly, cardiopulmonary development, angiogenesis and osteogenesis [4-8]. Previous studies demonstrated that MFAP2 knockout resulted in adipocyte hypertrophy, insulin resistance, and bone degeneration [9-11]. In addition, MFAP2 accelerated the migration, invasion, and epithelial-mesenchymal transition (EMT) of tumor cells and could act as a novel diagnostic and prognostic biomarker in human cancers [12-16].
MFAP2 can interact with diverse bioactive molecules, such as transcription factor, transforming growth factors, bone morphogenetic proteins, and Notch, via anionic acidic and sulfotyrosine residues [6, 17, 18]. Previous studies have shown that the lymphoid enhancer-binding factor (LEF)/TCF – an important transcription factor family – could promote cancer progression, including endometrial carcinoma [19-23]. To date, there have been no pertinent research studies concerning the interaction between MFAP2 and members of the LEF/TCF family, nor on whether this interaction influences the progression of UCEC. The present study aimed to determine the expression levels of MFAP2 in UCEC compared with para-carcinoma tissues using online datasets and samples from patients with UCEC. Based on the TCGA database, we found that TCF7L1 is significantly upregulated in UCEC tissues. We then continued to investigate the interaction between TCF7L1 and MFAP2. Furthermore, the roles of MFAP2 in the TCF7L1 signaling axis and UCEC cell proliferation, migration, invasion, and apoptosis were also investigated by in vitro experiments and bioinformatics analysis.
Material and methods
Clinical sample collection
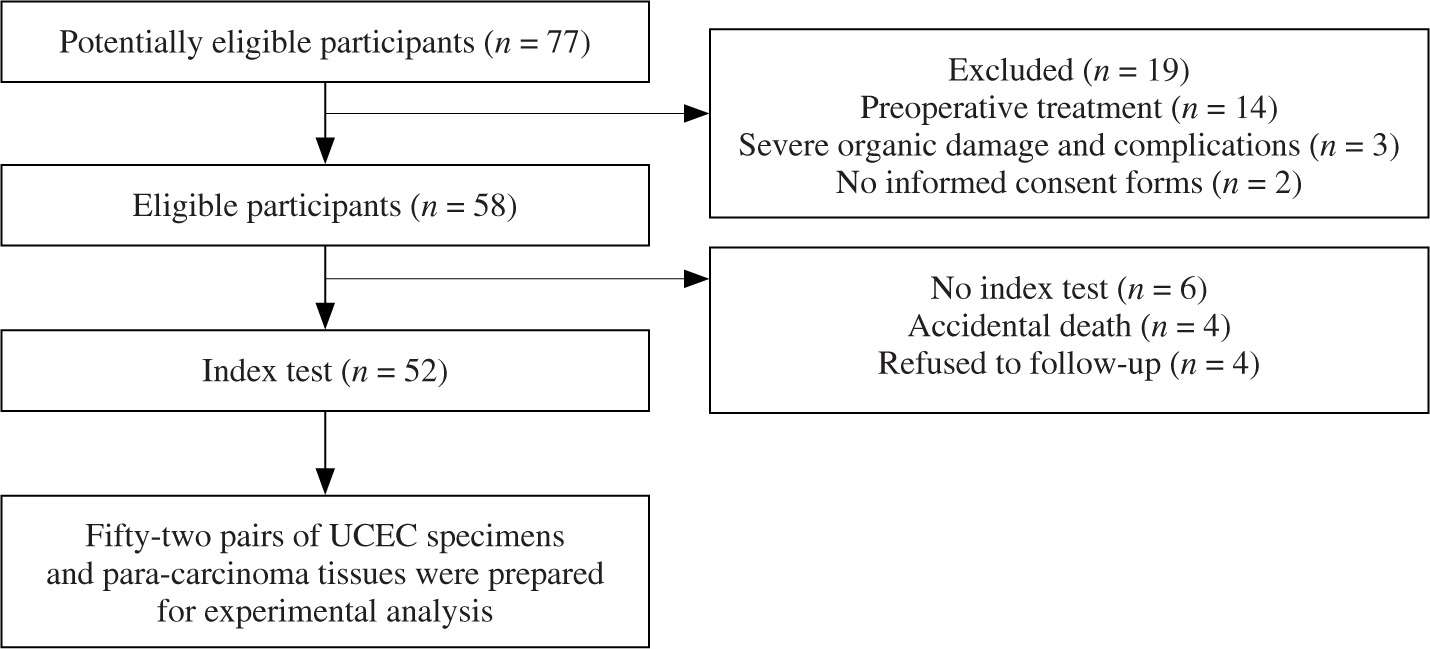
In the current cohort, a total of 52 pairs of UCEC and para-carcinoma tissues were collected from the First Affiliated Hospital of Ningbo University. The patient flow diagram is presented in Figure 1. After collection, the clinical specimens were immediately stored in liquid nitrogen. This study was approved by the Ethics Committee of the First Affiliated Hospital of Ningbo University (approval no. 2020C01009) on January 1, 2020. Furthermore, all patients signed informed consent forms.
Cell culture
The endometrial stromal cell line, hESC, and the UCEC cell lines RL95-2, HHUA and Ishikawa, were obtained from Cell Resource Center, Shanghai Institute of Life Sciences, Chinese Academy of Sciences (Shanghai, China). Cells were cultured in DMEM containing 10% fetal bovine serum at 37°C in a humidified atmosphere of 5% CO2/95% air.
Cell transfection and plasmid constructs
Specific small interfering (si)-RNAs targeting MFAP2 (si-MFAP2) and TCF7 (si-TCF7) were designed using an online tool (http://rnaidesigner.thermofisher.com/rnaiexpress) and synthesized by Sangon Biotech Co., Ltd. The MFAP2 overexpression plasmids were purchased from GeneCopoeia, Inc. RL95-2 and Ishikawa cells were transfected with the above plasmids using Lipofectamine 2000 (Invitrogen; Thermo Fisher Scientific, Inc.), according to the manufacturer’s protocols.
Reverse transcription-quantitative PCR (RT-qPCR)
Total RNA was extracted using TRIzol (Invitrogen; Thermo Fisher Scientific, Inc.). RNA was reverse transcribed into cDNA using MMLV transcriptase (Promega Corporation). qPCR was performed on the ABI 7500 Real-Time PCR System (Applied Biosystems; Thermo Fisher Scientific, Inc.) with the TaqMan quantitative real-time PCR kit (Thermo Fisher Scientific, Inc.). The primer sequences were synthesized by Sangon Biotech Co., Ltd. and were as follows: for MFAP2, forward, 5´-CCCAAGCTTGTGAGGAACAGTACCCGT-3´, and reverse, 5´-CGGAATTCGATACTCCCCCAACCCGA-3´; for TCF7L1, forward, 5´-TCGTCCCTGGTCAACGAGT-3´, and reverse, 5´-ACTTCGGCGAAATAGTCCCG-3´; and for GAPDH, forward, 5´-GTCTCCTCTGACTTCAACAGCG-3´, and reverse, 5´-ACCACCCTGTTGCTGTAGCCAA-3´.
Western blot analysis
Total proteins were extracted using a RIPA buffer (Beyotime Institute of Biotechnology). Western blot analysis was performed as previously described [24]. The primary antibodies used were as follows: Anti-MFAP2 (cat. no. ab231627; dilution, 1 : 1,000), anti-zinc finger E‑box binding homeobox 2 (ZEB2; cat. no. ab138222; dilution, 1 : 1,000; both from Abcam), anti-β-catenin (cat. no. #9562; dilution, 1 : 2,000), anti-N-cadherin (cat. no. #4061; dilution, 1 : 1,000), anti-TCF7L1 (cat. no. #2883; dilution, 1 : 1,000; all from CST), anti-E-cadherin (cat. no. sc-7870; dilution, 1 : 1,000; Santa Cruz Biotechnology, Inc.), anti-c-Myc (cat. no. GTX103436; dilution, 1 : 1,000; GeneTex, Inc.) and anti-cyclin D1 (cat. no. 701421; dilution, 1 : 1,000; Thermo Fisher Scientific, Inc.). β-actin (cat. no. sc-130065; dilution, 1 : 2,000; Santa Cruz Biotechnology, Inc.) was used as an internal reference gene.
Cell Counting Kit 8 (CCK-8) assay
Cell proliferation was assessed using a CCK-8 assay kit (Dojindo Laboratories, Inc.), according to the manufacturer’s instructions. Finally, the absorbance was measured at a wavelength of 450 nm.
Transwell assays
Transwell invasion and migration assays were performed in RL95-2 and Ishikawa cells using Transwell plates (8-μm pore size) precoated or not with Matrigel, respectively, as previously described [25].
TUNEL assay
Cell apoptosis was assessed using a TUNEL kit (cat. no. C1090; Beyotime Institute of Biotechnology), as previously described [26]. The proportion of apoptotic cells was determined via counting the TUNEL-positive cells.
Bioinformatics analysis
The mRNA expression levels of MFAP2 were determined in the Gene Expression Profiling Interactive Analysis (GEPIA) dataset (http://gepia.cancer-pku.cn/) using The Cancer Genome Atlas (TCGA) and genotype-tissue expression (GTEx) databases, as previously described [27]. MFAP2-related genes in UCEC were predicted in a set of 587 TCGA RNAseq samples using R (version 3.6.3) and ggplot2 software, as described previously [28]. The functions of MFAP2 and its related genes were predicted using Gene Ontology (GO) and Kyoto Encyclopedia of Genes and Genomes (KEGG) enrichment analysis by DAVID (https://david.ncifcrf.gov/summary.jsp). The alterations in MFAP2 and TCF7L1 genes were analyzed using the cBioPortal online tool (http://www.cbioportal.org/). The prognostic significance of MFAP2 and TCF7L1 expression in patients with UCEC was assessed using the Kaplan-Meier Plotter online tool (http://kmplot.com/analysis/index.php?p=background). In addition, the molecular mechanisms underlying the effect of TCF7L1 on the pathogenesis of UCEC were predicted using KEGG (https://www.genome.jp/kegg). The differences in the expression of a set of MFAP2-related genes in UCEC were analyzed by Gene Set Enrichment Analysis (GSEA) using the TCGA database with the DESeq2 package (version 1.26.0), as previously described [29]. The ssGSEA algorithm and the ESTIMATE algorithm were used to investigate the association of MFAP2 with immune infiltration in UCEC patients. The ssGSEA algorithm provided by the R package GSVA (version 1.46.0) was used to calculate immune infiltration based on markers for 24 immune cells as described previously [30, 31]. Immunoscore, ESTIMATEScore, and StromalScore were calculated using the R package “estimate” (version 1.0.13).
Statistical analysis
Data are expressed as the mean ± standard deviation. All statistical analyses were performed using IBM SPSS Statistics version 19.0 (IBM Corp.). Normal distribution was assessed by the Shapiro-Wilk test. The differences between two groups were compared using Student’s t-test or the Mann-Whitney U test. The differences among multiple groups were analyzed by ANOVA followed by Tukey’s HSD post hoc test. Survival analysis was performed using the log-rank test. Pearson correlation analysis was carried out to evaluate the association between TCF7L1 and MFAP2. P < 0.05 was considered to indicate a statistically significant difference.
Results
MFAP2 mRNA expression is elevated in UCEC tissues
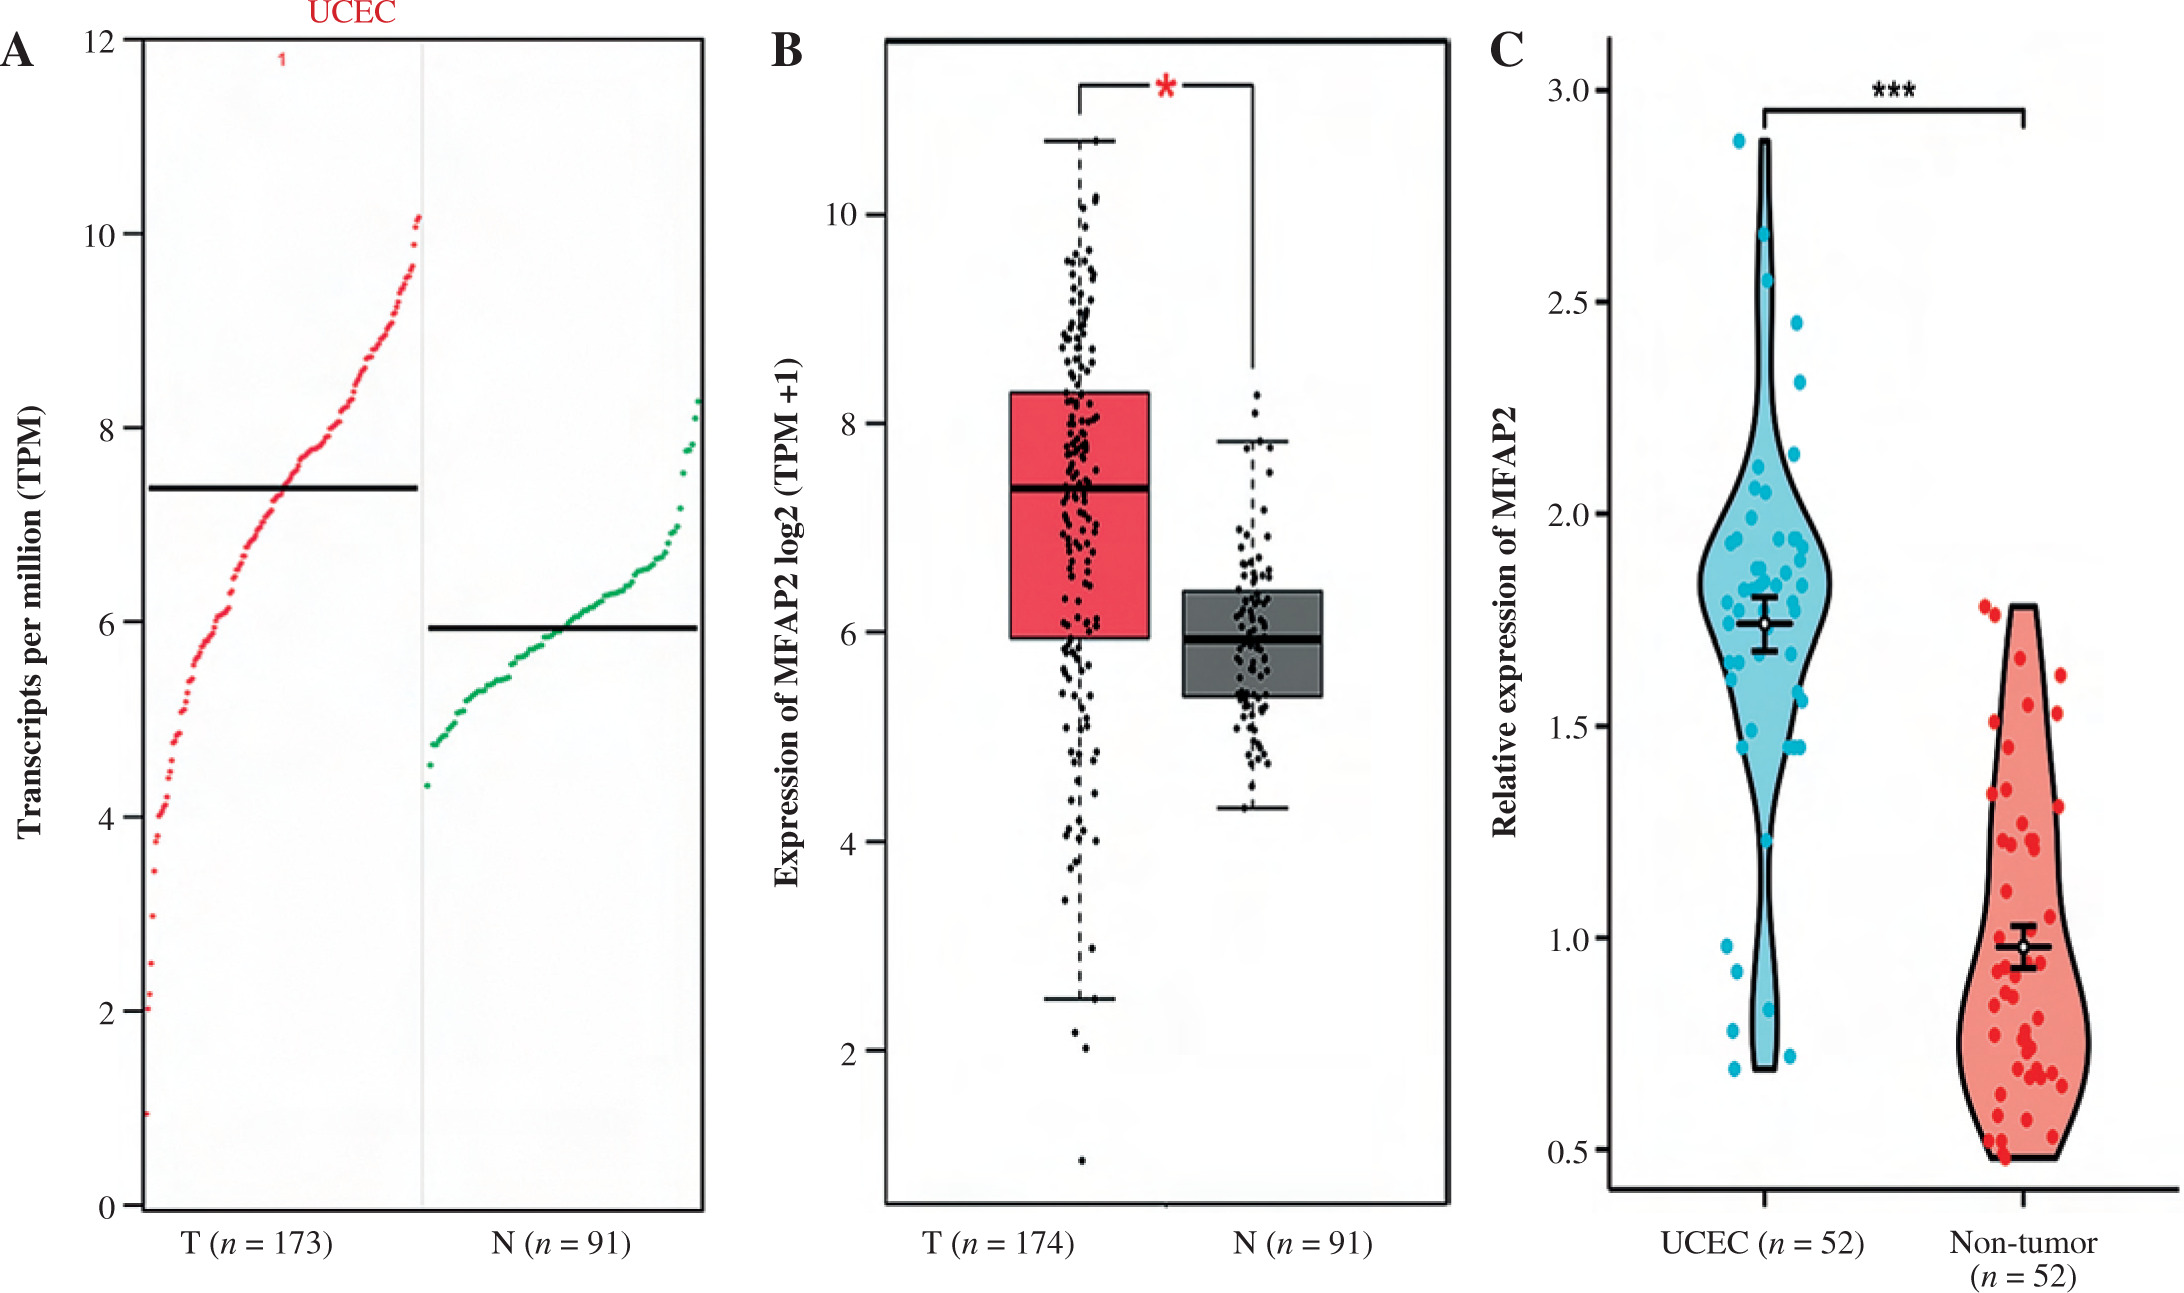
Bioinformatics analysis using the GEPIA (http://gepia.cancer-pku.cn/) database was carried out to compare the expression levels of MFAP2 between UCEC and normal tissues. The results demonstrated that MFAP2 mRNA (Fig. 2A) and protein (Fig. 2B) levels were markedly elevated in UCEC tissues compared with normal ones. In a cohort including 52 pairs of UCEC specimens and para-carcinoma tissues, MFAP2 was upregulated in UCEC specimens compared with the corresponding normal tissues (Fig. 2C).
MFAP2-related genes and GO/KEGG/GSEA enrichment analysis
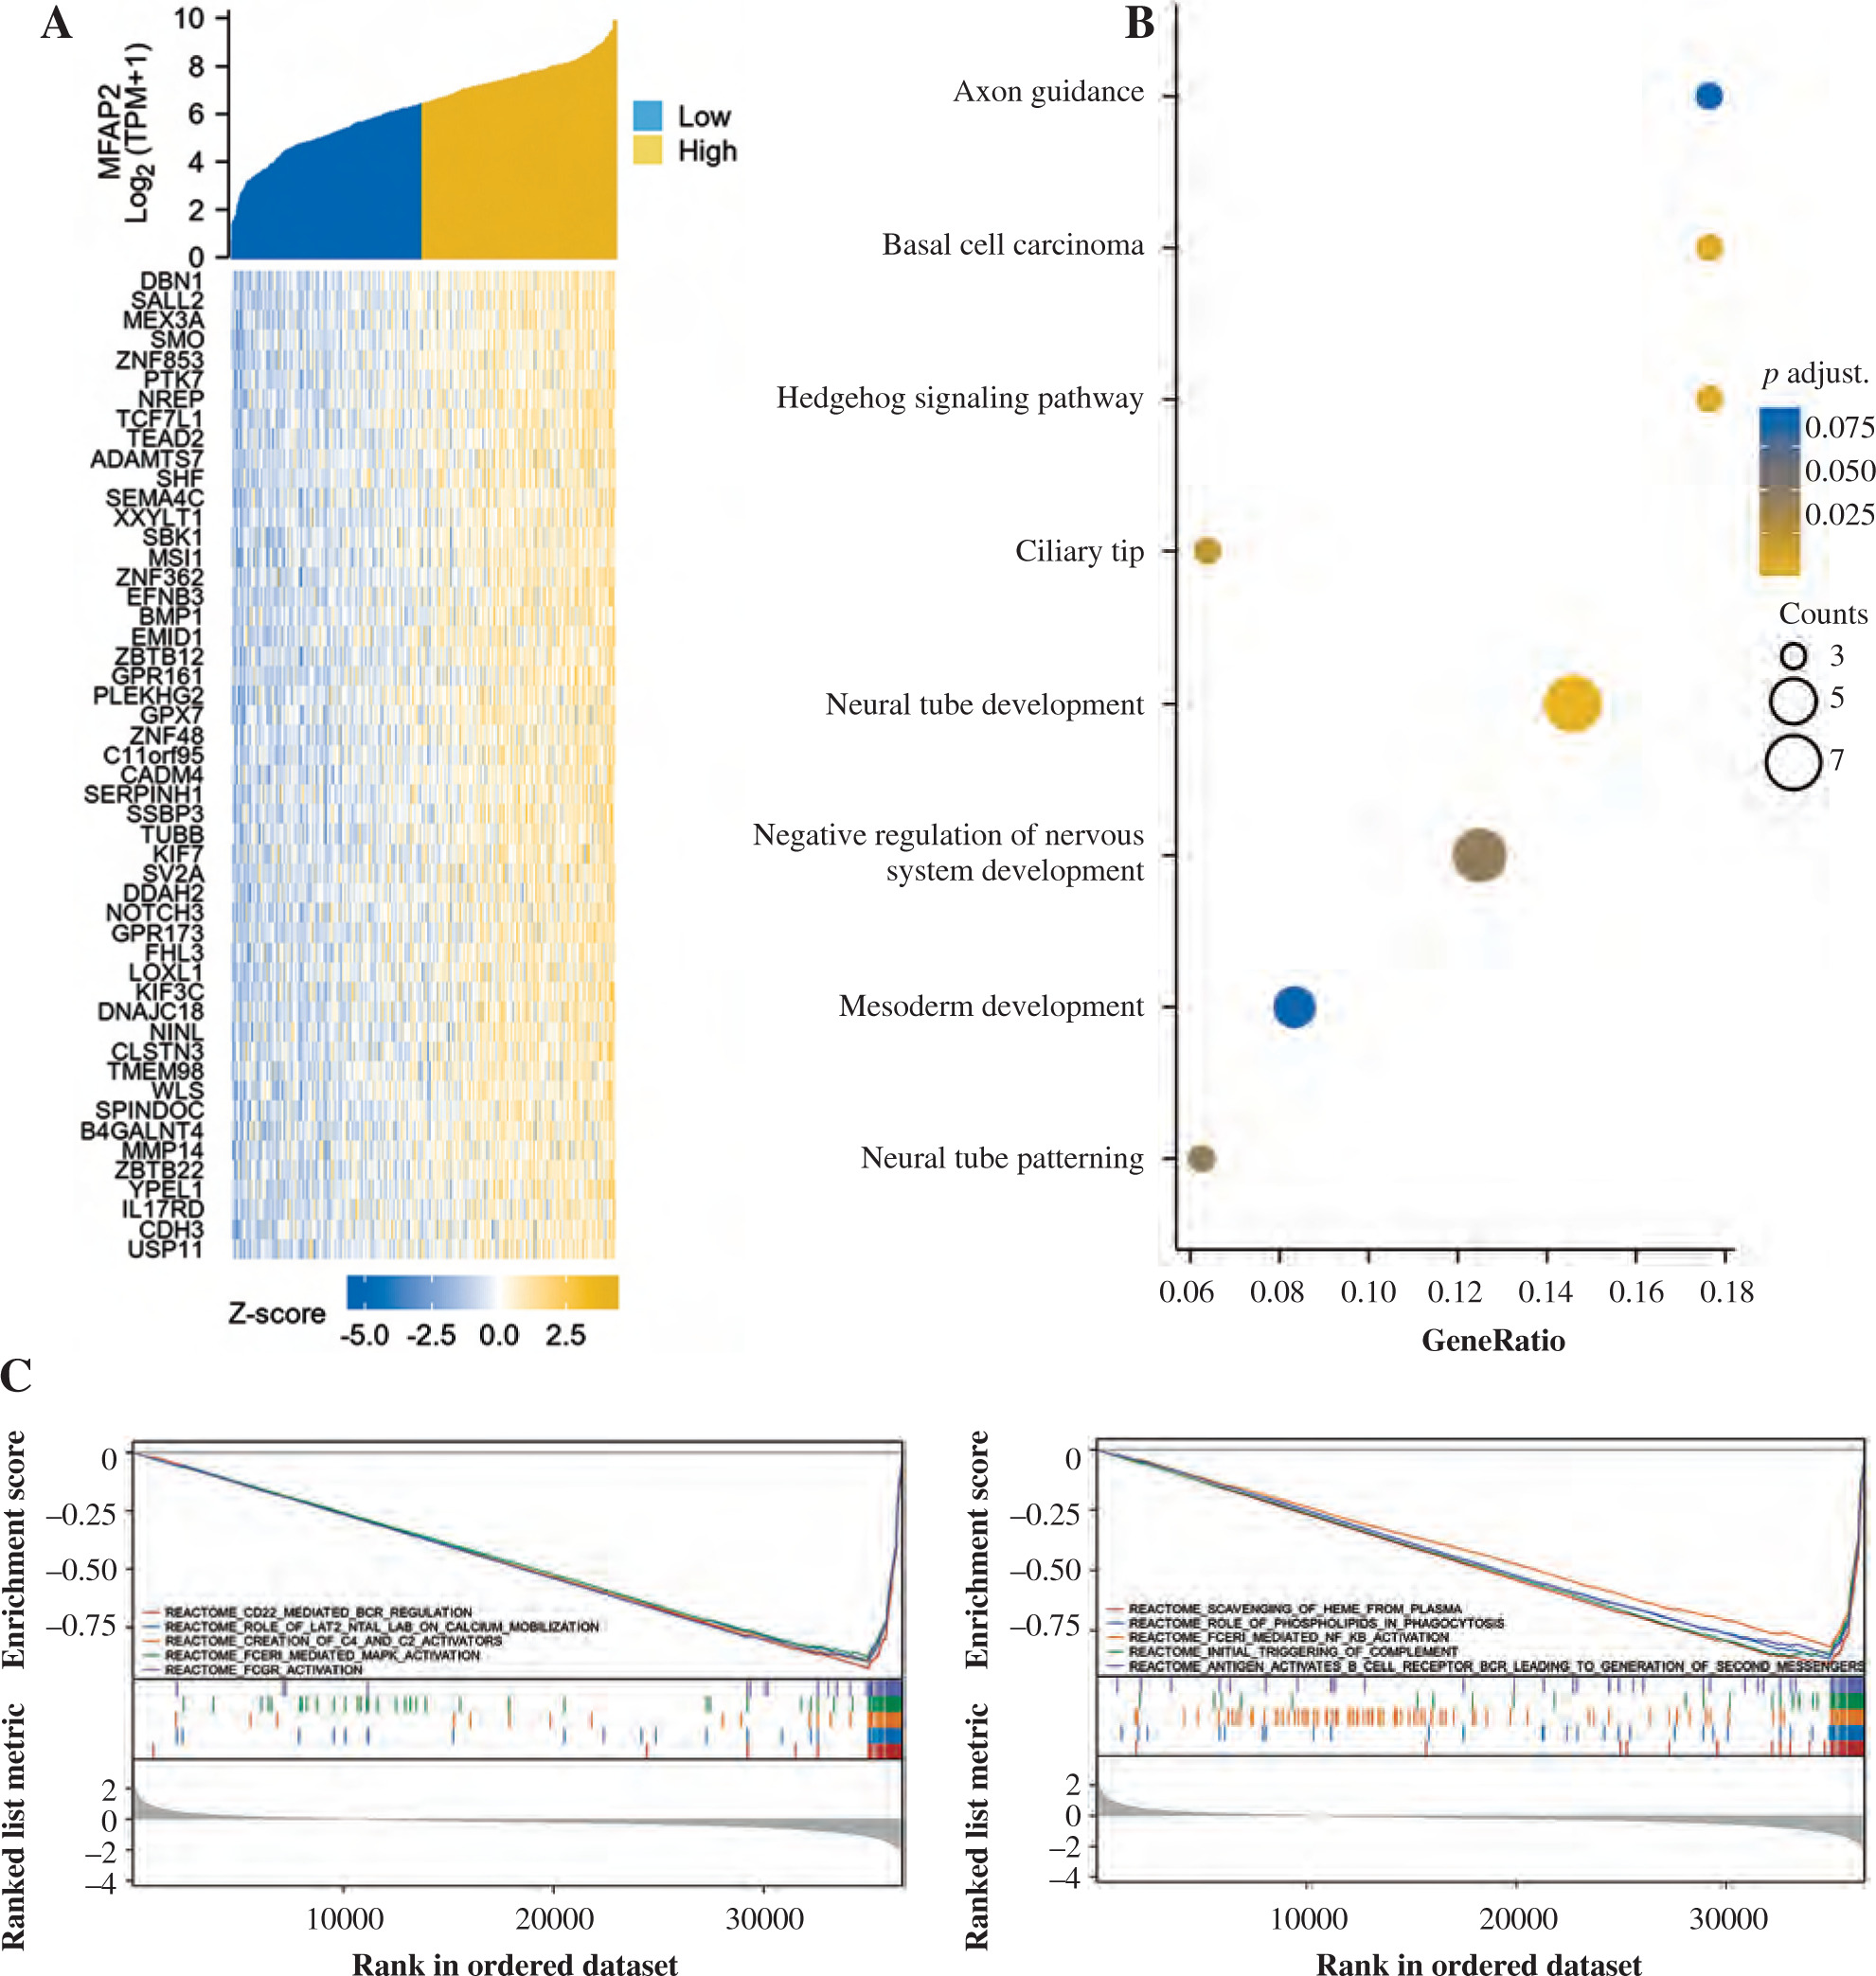
Based on a set of 587 TCGA RNAseq samples, the top 50 MFAP2-related genes were recorded and a co-expressive heatmap was constructed (Fig. 3A). The expression levels of the above genes were positively associated with MFAP2 expression (Fig. 3A). Subsequently, the functions of MFAP2 and MFAP2-related genes were predicted using GO and KEGG enrichment analysis (DAVID; https://david.ncifcrf.gov/summary.jsp). GO analysis predicted that these genes were associated with several biological processes, such as neural tube development, neural tube patterning, negative regulation of the nervous system, and mesoderm development, as well as the cellular component ciliary tip. Additionally, KEGG analysis indicated that MFAP2 and MFAP2-related genes were involved in the hedgehog signaling pathway, basal cell carcinoma, and axon guidance (Fig. 3B). Furthermore, GSEA analysis predicted that MFAP2 and MFAP2-related genes were enriched in 91 signaling pathways. Among them, the top 10 signaling pathways were as follows: ‘REACTOME_CD22_MEDIATED_BCR_REGULATION’, ‘REACTOME_ROLE_OF_LAT2_NTAL_LAB_ON_CALCIUM_MOBILIZATION’, ‘REACTOME_CREATION_OF_C4_AND_C2_ACTIVATORS’, ‘REACTOME_FCERI_MEDIATED_MAPK_ACTIVATION’, ‘REACTOME_FCGR_ACTIVATION’, ‘REACTOME_SCAVENGING_OF_HEME_FROM_PLASMA’, ‘REACTOME_ROLE_OF_PHOSPHOLIPIDS_IN_PHAGOCYTOSIS’, ‘REACTOME_FCERI_MEDIATED_NF_KB_ACTIVATION’, ‘REACTOME_INITIAL_TRIGGERING_OF_COMPLEMENT’, ‘REACTOME_ANTIGEN_ACTIVATES_B_CELL_RECEPTOR_BCR_LEADING_TO_GENERATION_OF_SECOND_MESSENGERS’ (Fig. 3C).
Fig. 2
MFAP2 mRNA expression is elevated in UCEC tissues. Based on TCGA database online bioinformatics software GEPIA (http://gepia.cancer-pku.cn/) was used to analyze MFAP2 transcripts (A) and mRNA expression (B) in UCEC specimens and normal tissues. A total of 52 pairs of UCEC specimens and para-carcinoma tissues were collected to detect MFAP2 mRNA expression using RT-qPCR (C). *p < 0.05, ***p < 0.001
MFAP2 expression is positively associated with TCF7L1 in UCEC
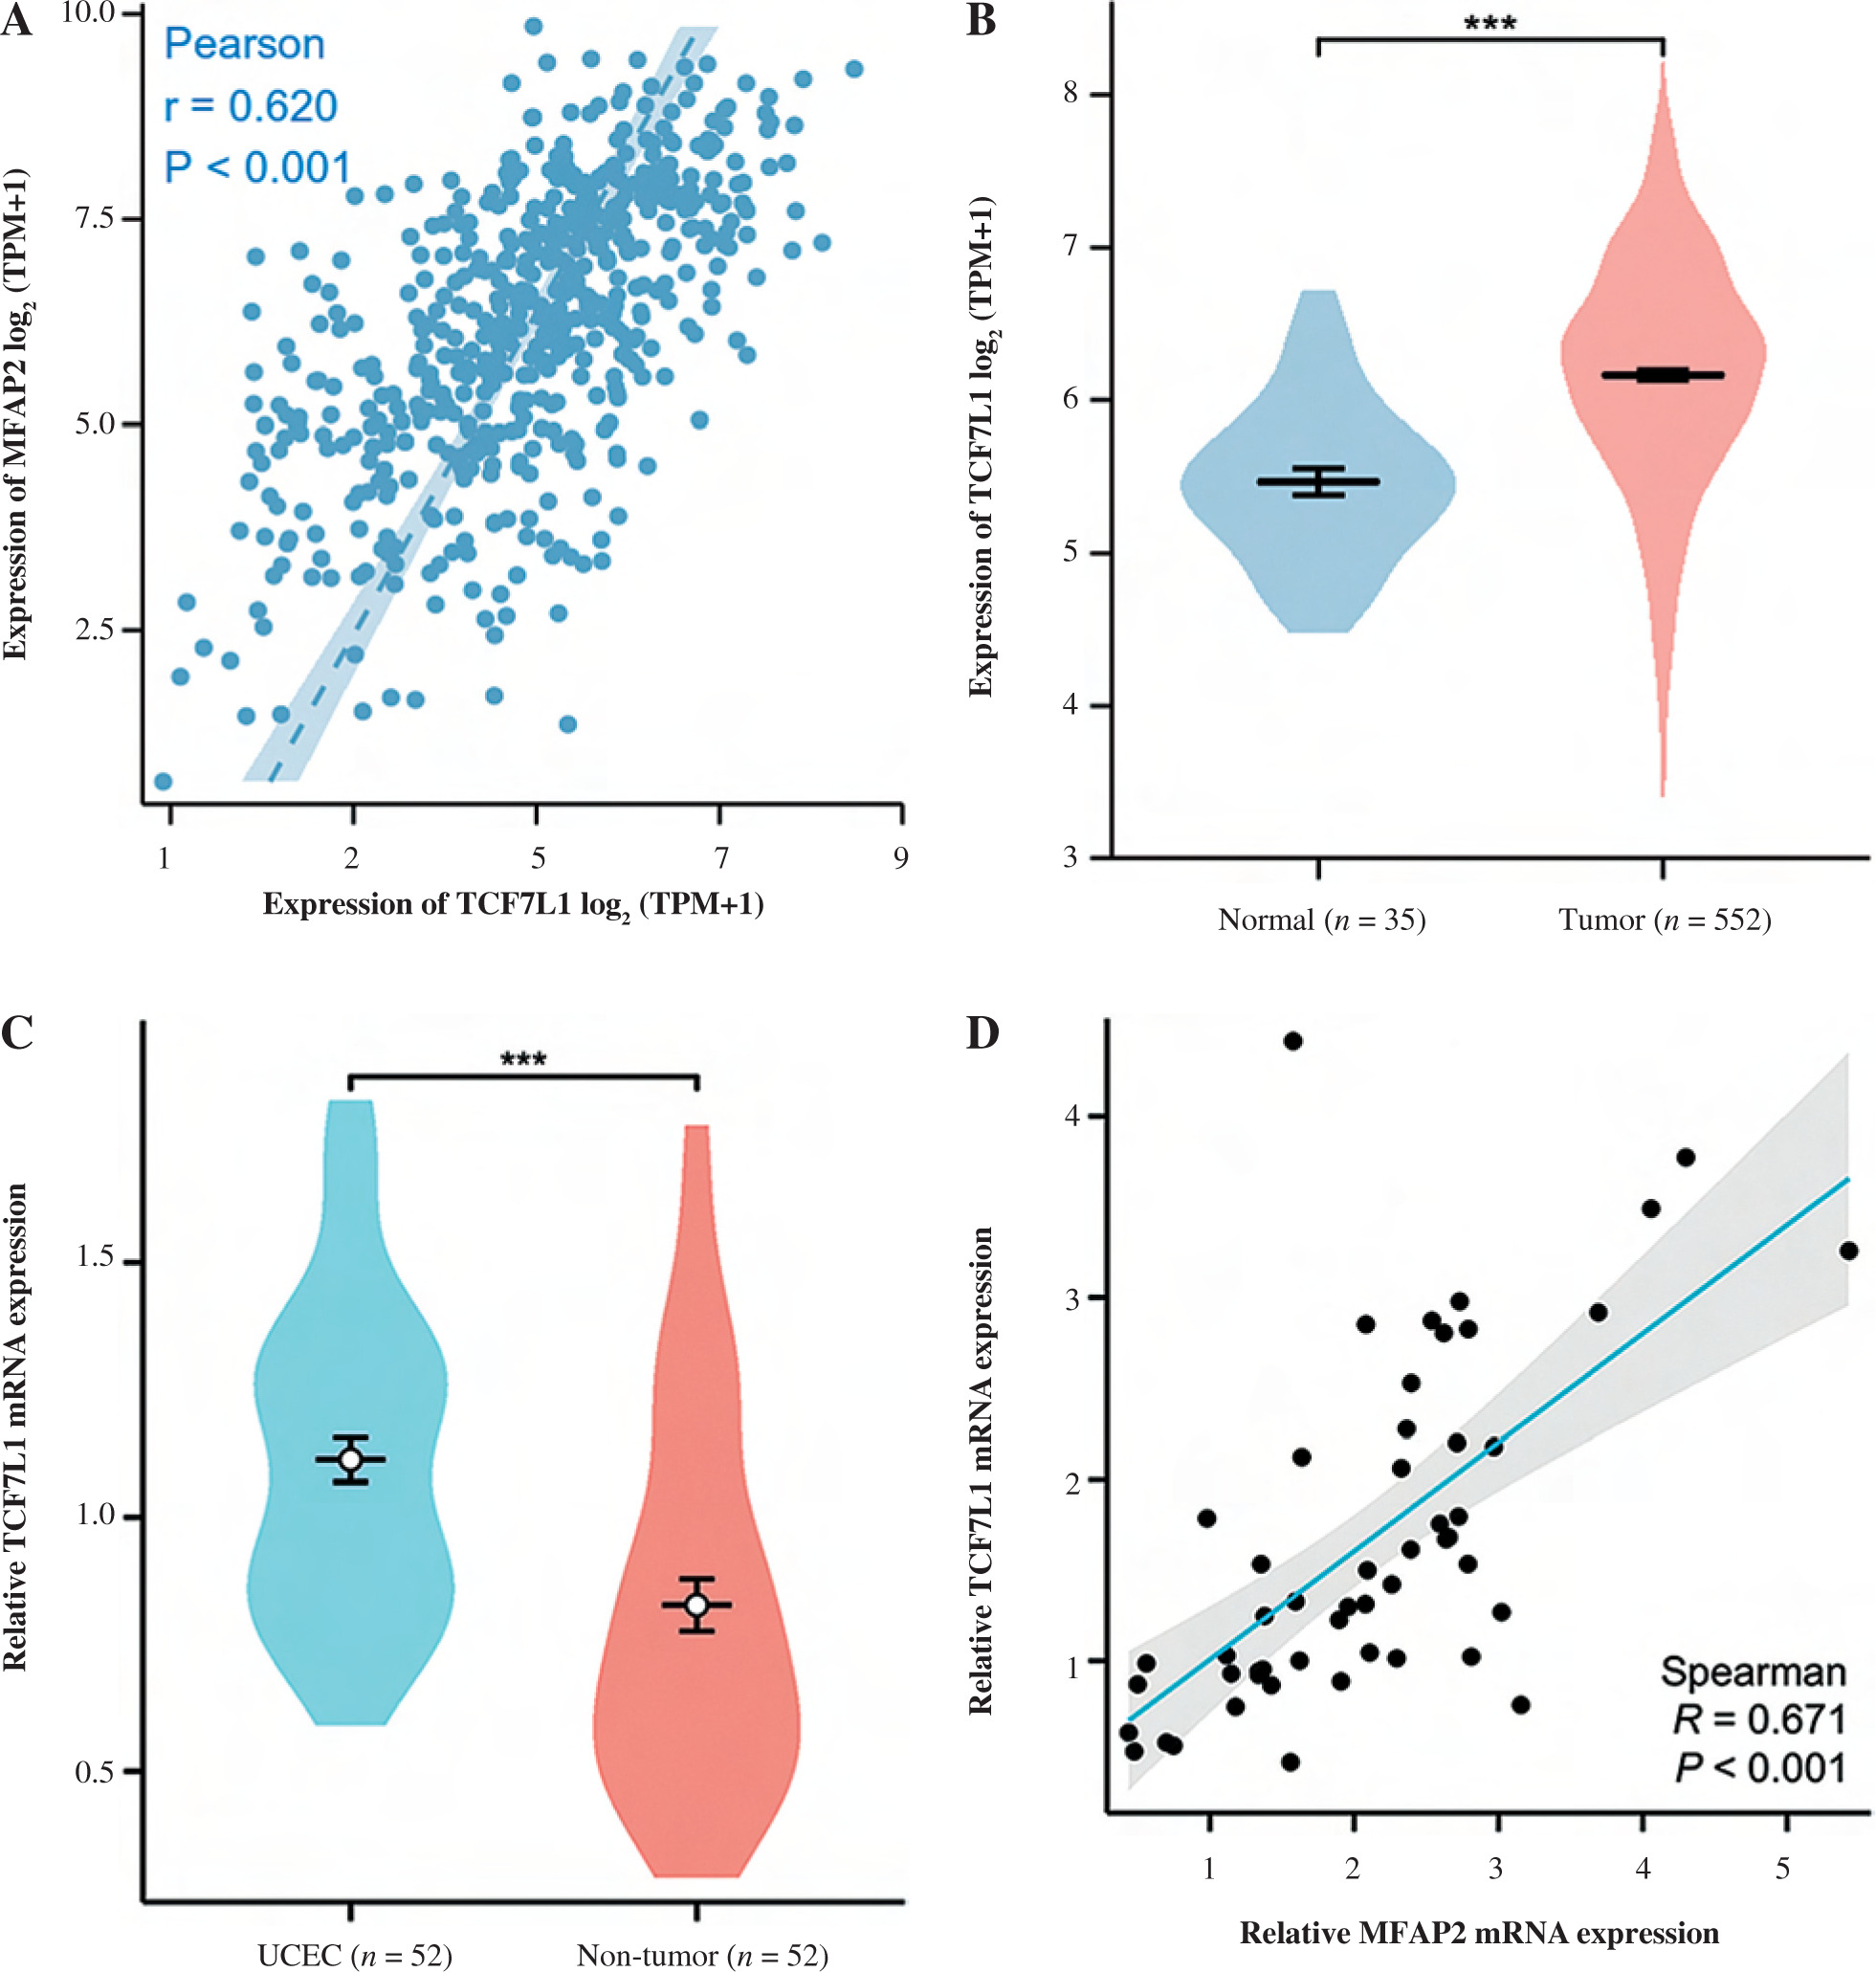
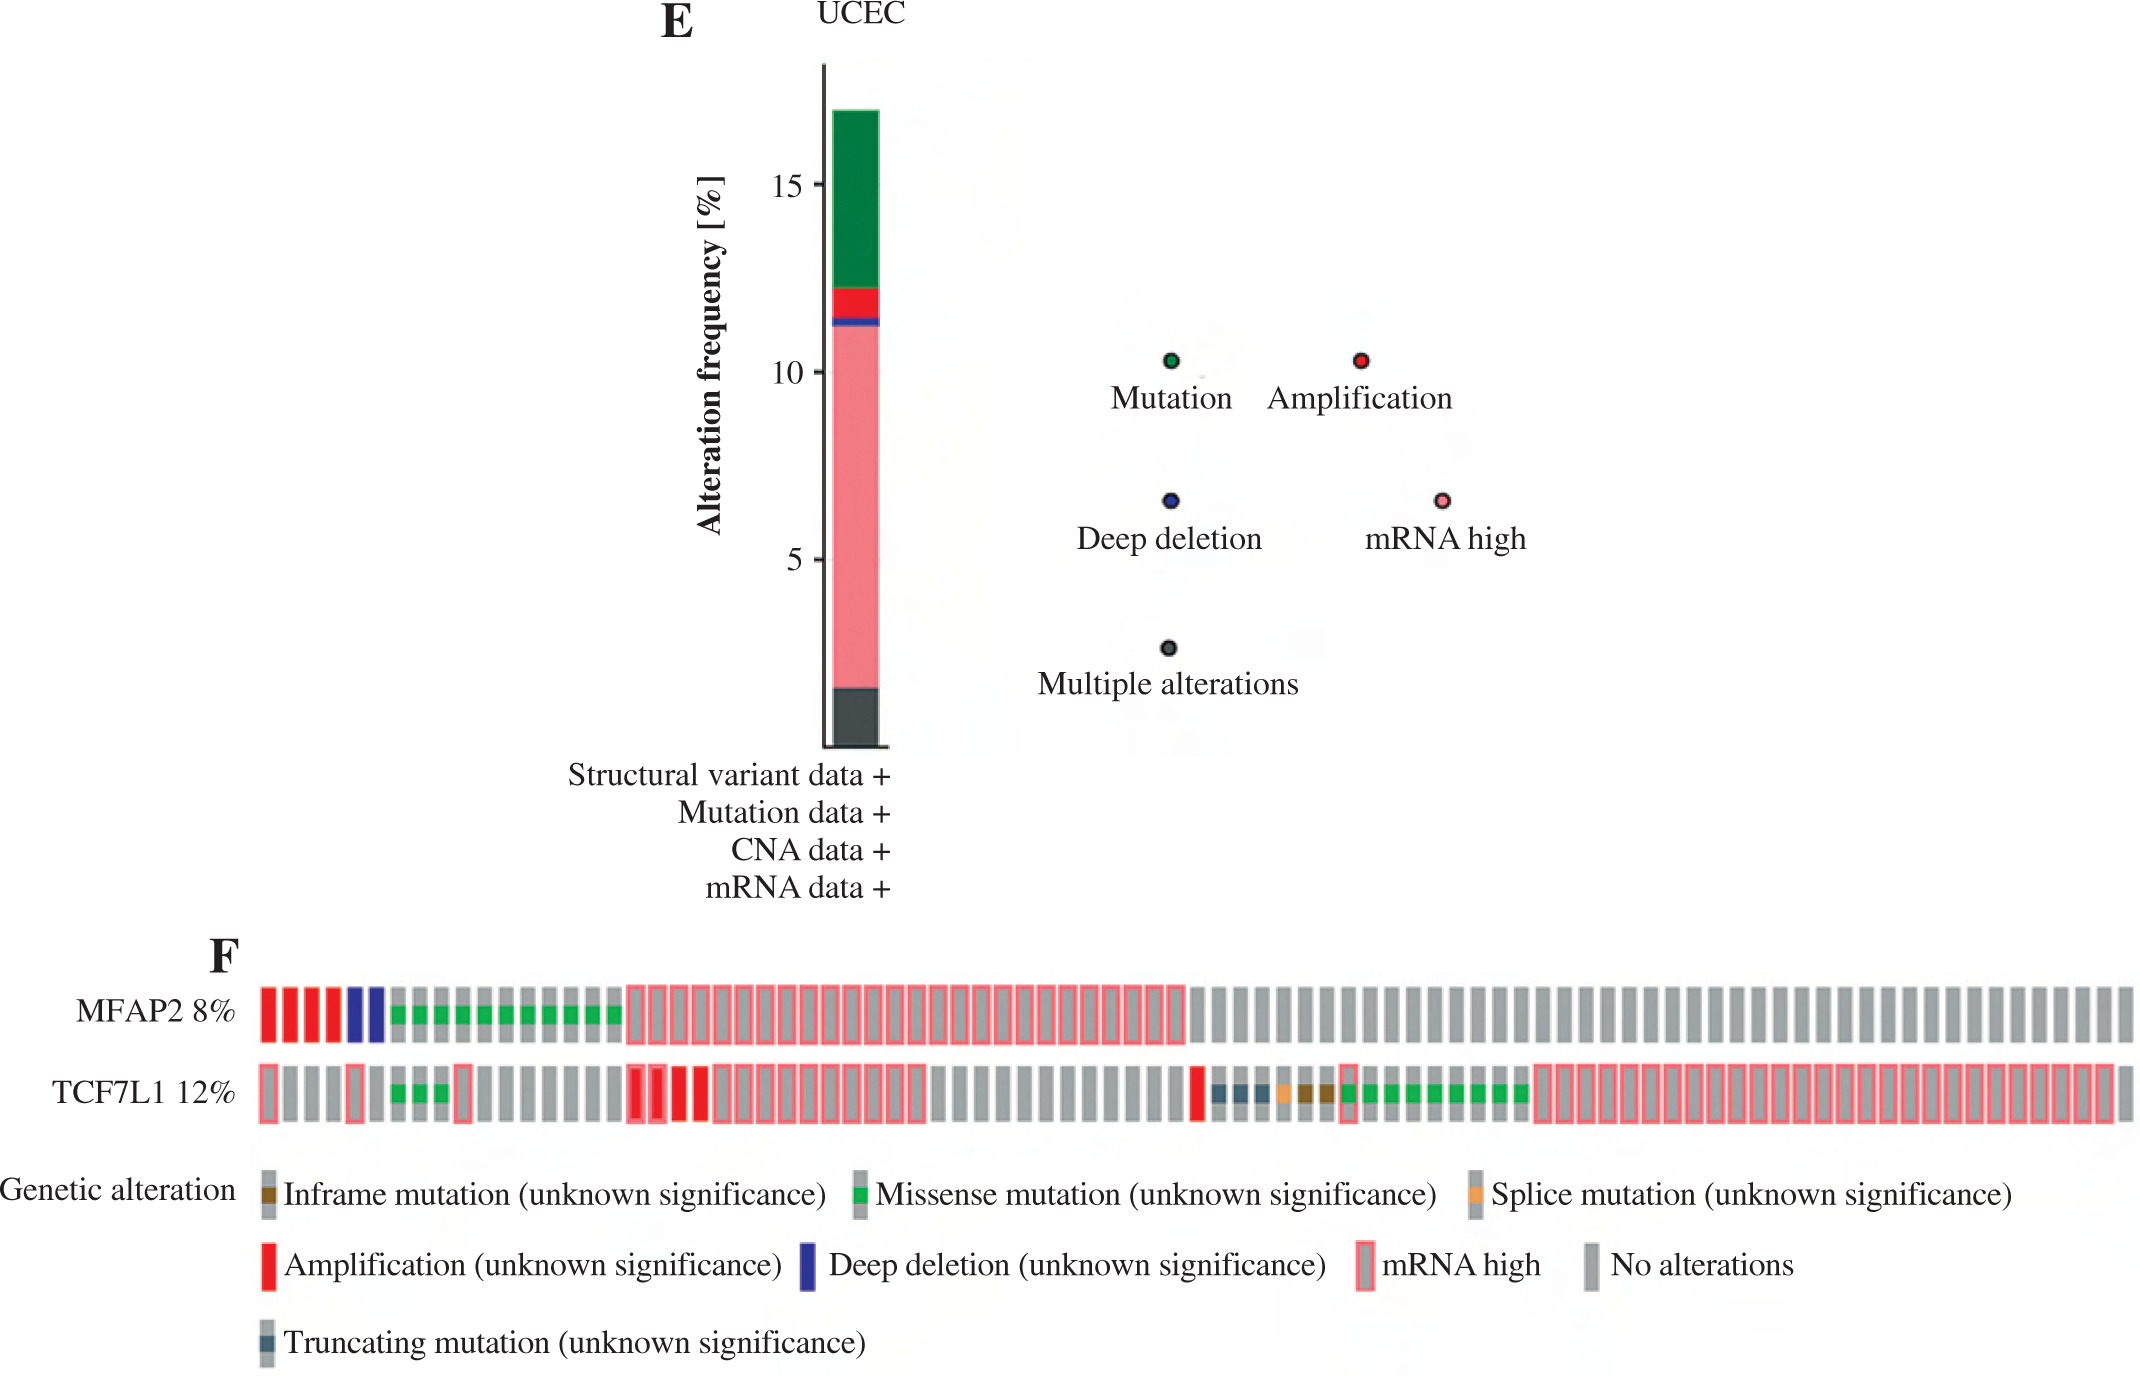
The underlying molecular mechanisms of TCF7L1 in the pathogenesis of UCEC were predicted using KEGG (https://www.genome.jp/kegg) analysis. The analysis demonstrated that the TCF/LEF family members could be involved in UCEC cell proliferation via c-Myc and cyclin D1 (CCND1). Based on the TCGA 587 RNAseq dataset, a significant positive association (r = 0.620, p < 0.001) between MFAP2 and TCF7L1 was obtained in UCEC (n = 552) and normal tissues (n = 35; Fig. 4A). In both the TCGA database (Fig. 4B) and the study population (Fig. 4C), the mRNA expression levels of TCF7L1 were significantly higher in UCEC tissues compared with the corresponding normal tissues. As shown in Fig. 4D, TCF7L1 mRNA expression was positively associated with MFAP2 expression (r = 0.647, p < 0.001) in patients with UCEC. In addition, the alterations in MFAP2 and TCF7L1 genes were analyzed using the cBioPortal online tool (http://www.cbioportal.org/). As shown in Figure 4E and F, MFAP2 and TCF7L1 genes were altered in 43/507 (8%) and 63/507 (12%) UCEC samples, respectively. Intriguingly, the alterations of mRNA expression were the most prominent finding in patients with UCEC (Fig. 4E, F).
MFAP2 and TCF7L1 upregulation predicts poor overall survival in patients with UCEC
The association between prognosis and MFAP2 or TCF7L1 expression in UCEC patients was predicted using the Kaplan-Meier Plotter online tool (http://kmplot.com/analysis/index.php?p=background). As shown in Figure 5A and B, MFAP2 or TCF7L1 upregulation was associated with shorter overall survival in patients with UCEC compared with that in patients with reduced MFAP2 or TCF7L1 expression levels. As shown in Figure 5C, CTNNB1 was not associated with overall survival in patients with UCEC. However, c-Myc upregulation (Fig. 5D) or CCND1 downregulation (Fig. 5E) was associated with shorter overall survival in patients with UCEC.
Fig. 3
MFAP2-related genes and GO/KEGG/GSEA enrichment analysis. The top 50 MFAP2-related genes in UCEC were predicted based on the TCGA 587 RNAseq dataset (A). The functions of MFAP2 and related genes were predicted using GO and KEGG enrichment analysis (DAVID; https://david.ncifcrf.gov/summary.jsp; B). GSEA enrichment analysis (C)
Overexpression of MFAP2 associated with inhibition of immune infiltration in UCEC
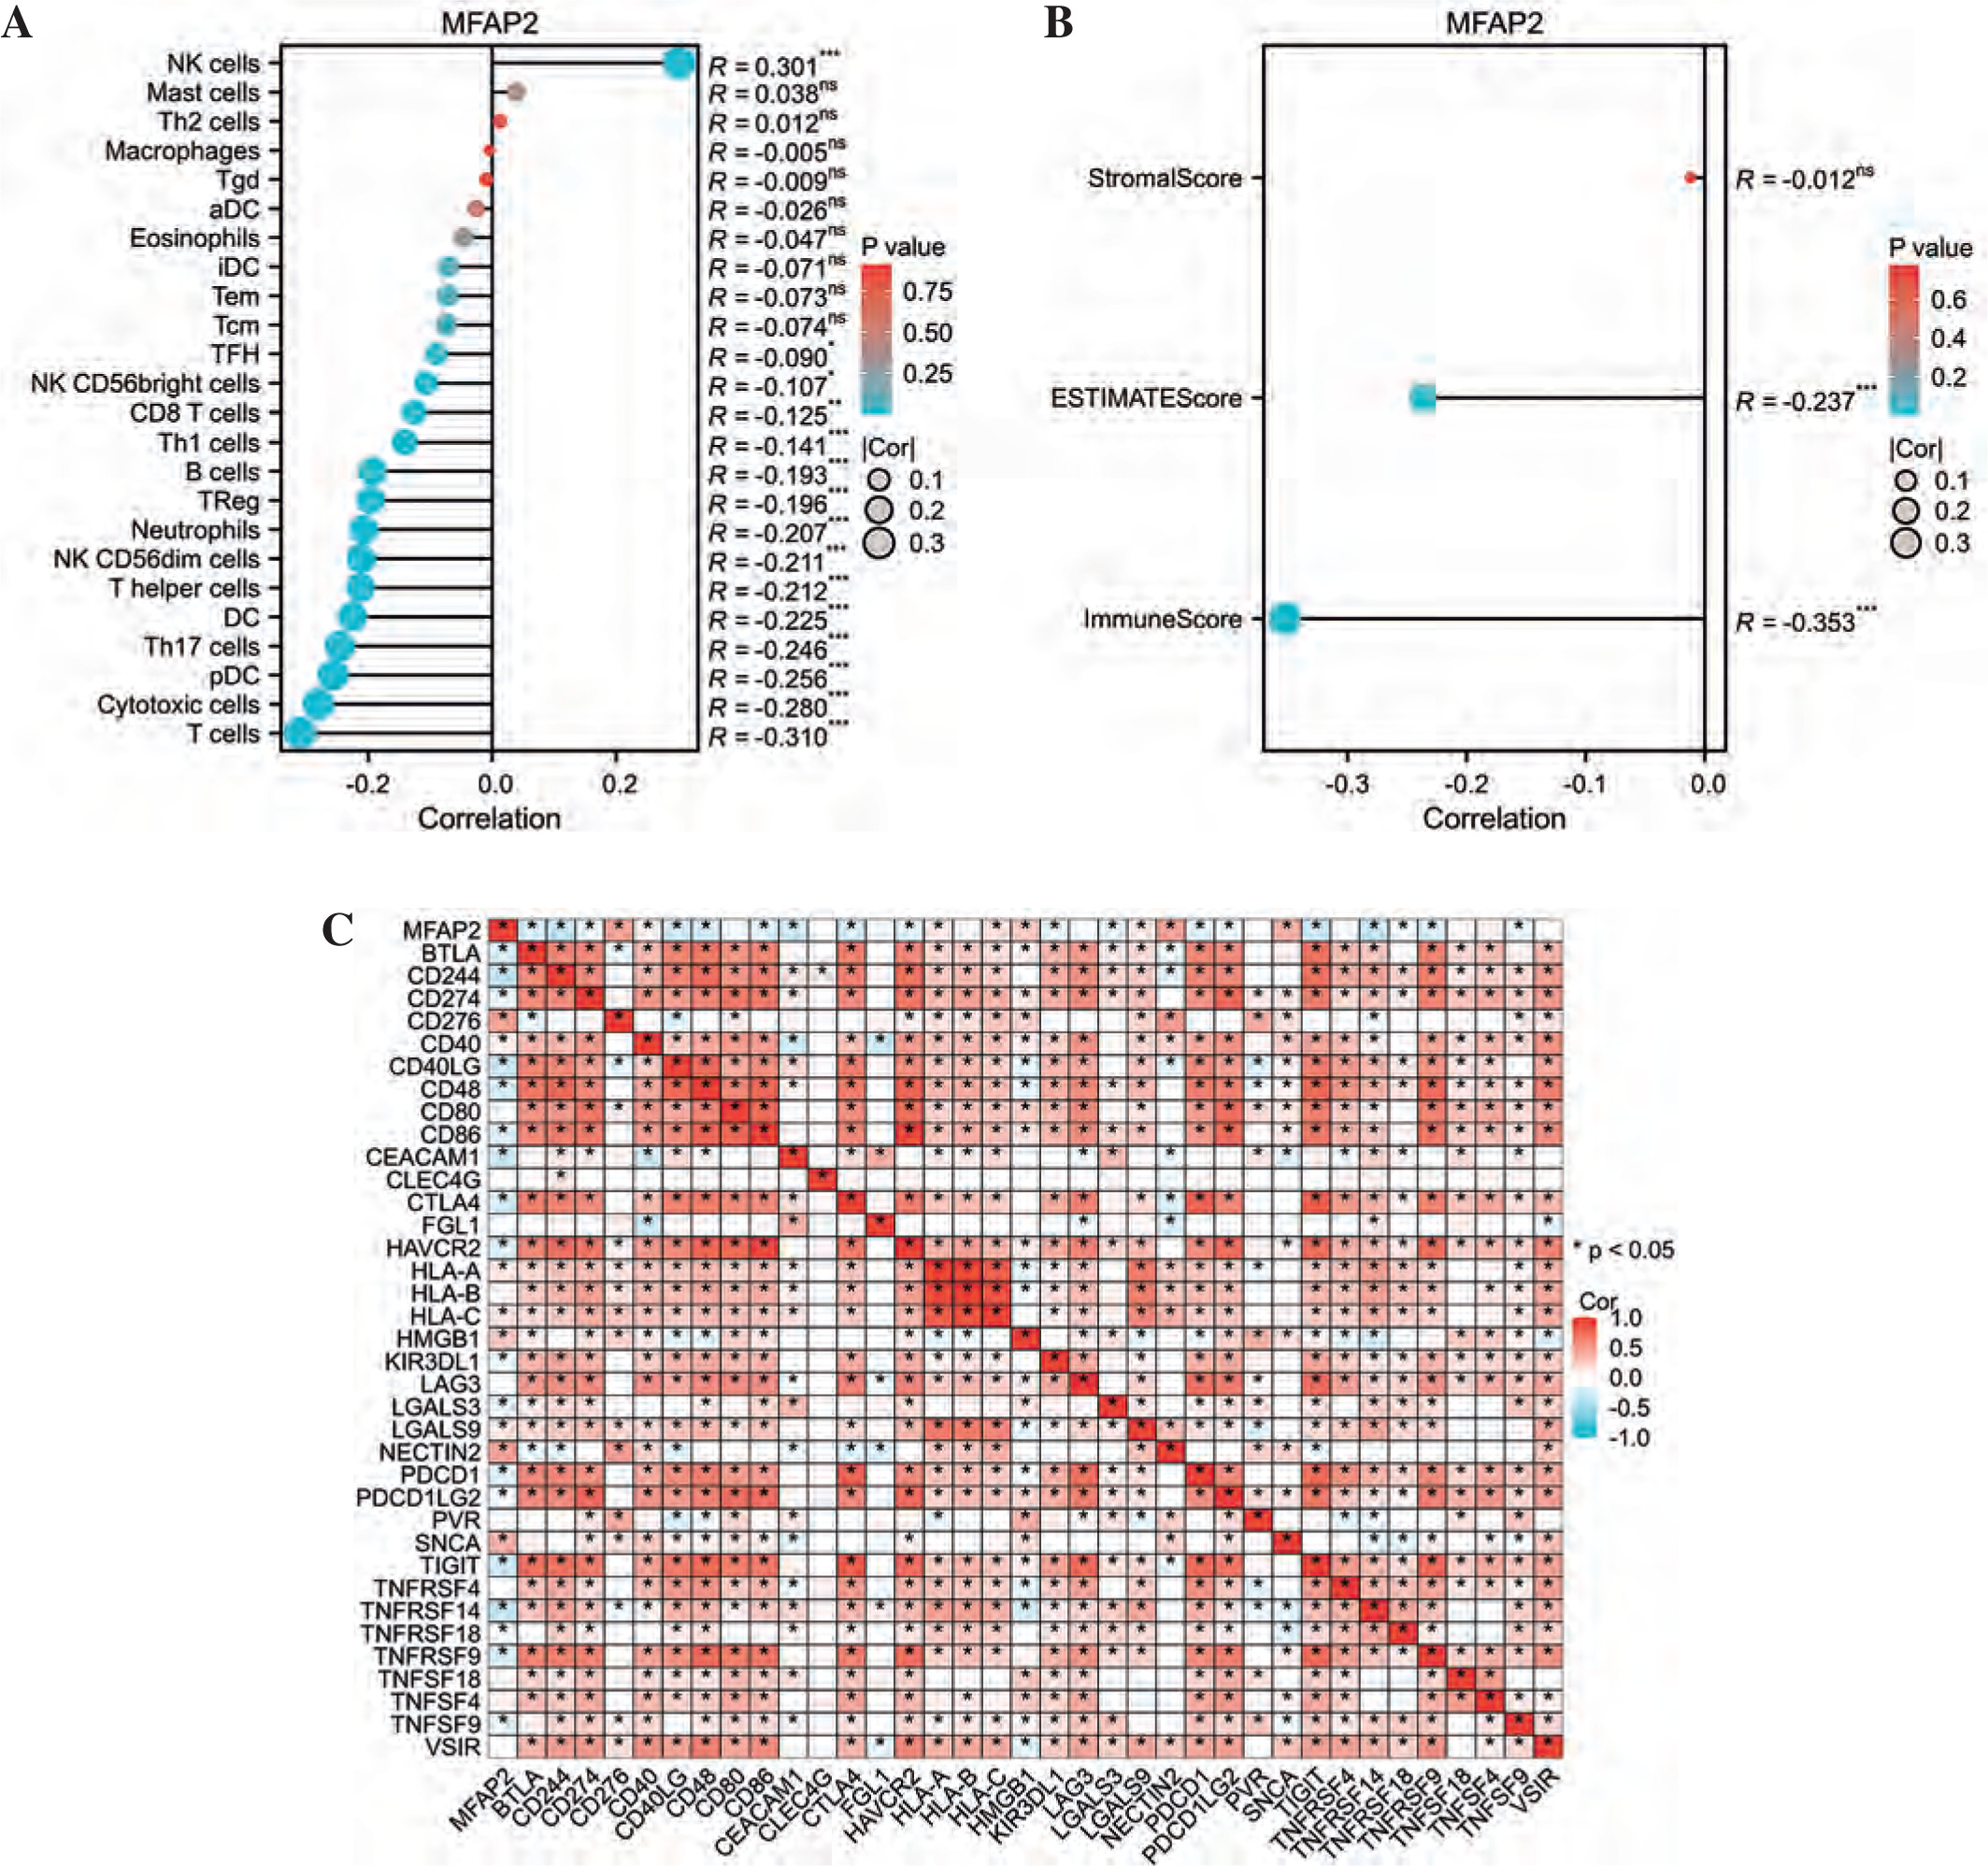
Our study sought to investigate the connection between MFAP2 and immune infiltration in UCEC. Using the ssGSEA algorithm (Fig. 6A), we observed a significant negative correlation between MFAP2 expression and the presence of T cells, cytotoxic cells, and pDC within the tumor microenvironment (TME) of UCEC patients. Additionally, the findings of the ESTIMATE algorithm also indicated a significant negative correlation between MFAP2 expression and Immunoscore (r = –0.353, p < 0.001), and ESTIMATEScore (r = –0.237, p < 0.001) (Fig. 6B). Based on the TCGA database, the relationship between MFAP2 and 36 prevalent immune checkpoint molecules (ICMs) [32] in UCEC was currently under investigation to validate the association between MFAP2 and immune cell enrichment. The results presented in Figure 6C demonstrate a significant negative correlation between MFAP2 and the majority of ICMs.
Fig. 4
MFAP2 expression is positively correlated with TCF7L1 in UCEC. The correlations between MFAP2 and TCF7L1 (A) and TCF7L1 expression (B) were analyzed using the R software package (version 3.6.3) based on the TCGA 587 RNAseq dataset. A total of 52 pairs of UCEC specimens and para-carcinoma tissues were collected to detect TCF7L1 mRNA expression using RT-qPCR (C). Pearson correlation analysis was performed to evaluate the association of MFAP2 and TCF7L1 in our cohort population (N = 52; D). ***p < 0.001 The alterations of MFAP2 and TCF7L1 genes were analyzed using the cBioPortal online tool (http://www.cbioportal.org/; E and F). ***p < 0.001
MFAP2 knockdown represses TCF7L1 and its downstream targets
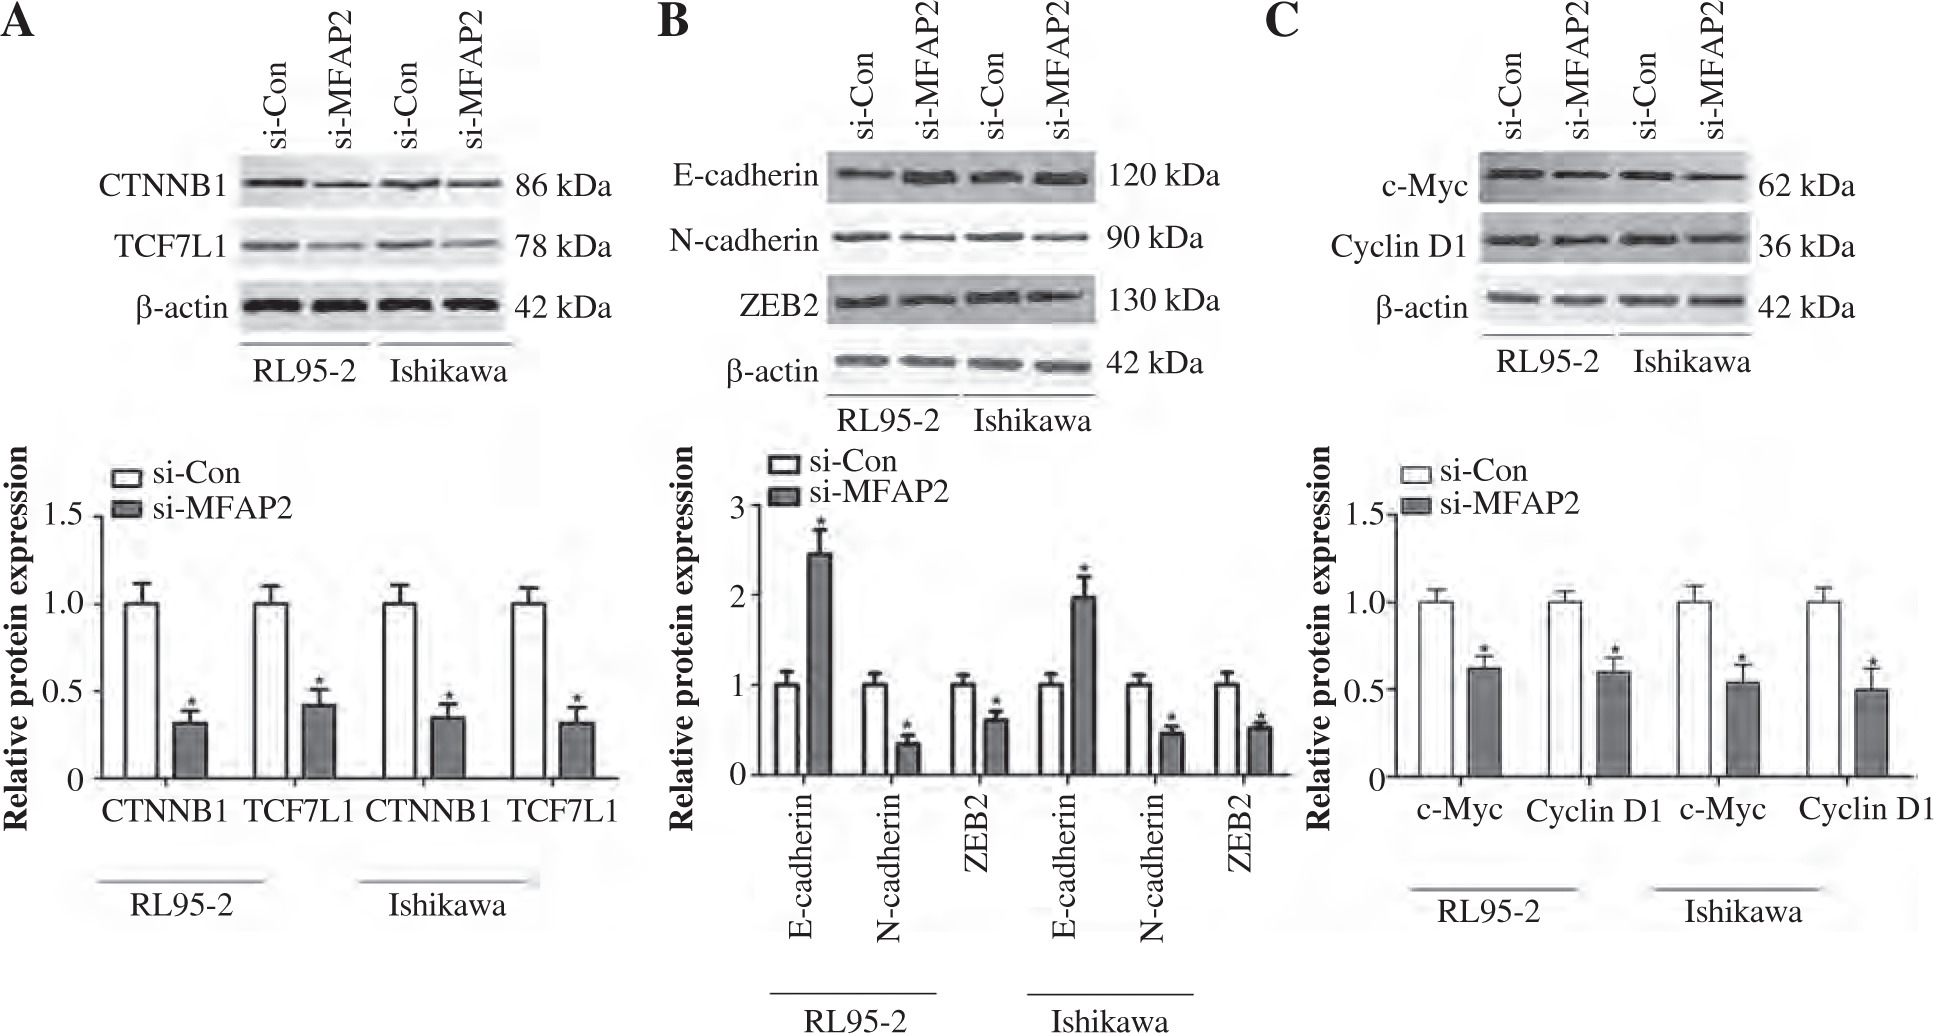
The TCF family members and their transcriptional co-activator, CTNNB1, play a significant role in cancer cell proliferation and EMT, which is accompanied by the loss of epithelial markers, such as E-cadherin, and the acquisition of mesenchymal ones, including N-cadherin and ZEB2, thus contributing to tumor cell metastasis [33, 34]. The present study aimed to investigate whether MFAP2 knockdown could mediate the expression of TCF7L1 and its downstream targets. The results indicated that MFAP2 knockdown notably reduced the protein expression levels of CTNNB1 and TCF7L1 in RL95-2 and Ishikawa cells (Fig. 7A). In addition, MFAP2 loss of function significantly increased the protein expression levels of E-cadherin and decreased those of N-cadherin and ZEB2 (Fig. 7B). Compared with the control group, RL95-2 and Ishikawa cell transfection with si-MFAP2 markedly inhibited the protein expression of c-Myc and cyclin D1 (Fig. 7C).
MFAP2 knockdown inhibits the proliferation, migration, and invasion, and enhances the apoptosis of RL95-2 and Ishikawa cells
In vitro experiments were performed to explore the roles of MFAP2 in the tumorigenicity of UCEC. Firstly, the results showed that the mRNA and protein expression levels of MFAP2 were markedly higher in UCEC cell lines compared with normal endometrial stromal cells (Fig. 8A). Subsequently, RL95-2 and Ishikawa were transfected with specific siRNA clones to repress MFAP2 expression. Therefore, CCK-8 assays demonstrated that MFAP2 knockdown notably reduced tumor growth in RL95-2 and Ishikawa cells (Fig. 8B). Both the migration and invasion abilities were assessed in MFAP2-depleted RL95-2 and Ishikawa cells (Fig. 8C). Furthermore, cell apoptosis was determined by TUNEL staining assay, and the results showed that the number of TUNEL-positive cells was significantly elevated in MFAP2-depleted RL95-2 and Ishikawa cells (Fig. 8D).
Fig. 5
High MFAP2 and TCF7L1 expression predicts poor overall survival in UCEC patients. The association between prognosis and MFAP2 (A), TCF7L1 (B), CTNNB1 (C), MYC (D) or CCND1 (E) expression in UCEC patients was analyzed using the Kaplan-Meier Plotter online tool (http://kmplot.com/analysis/index.php?p=background)
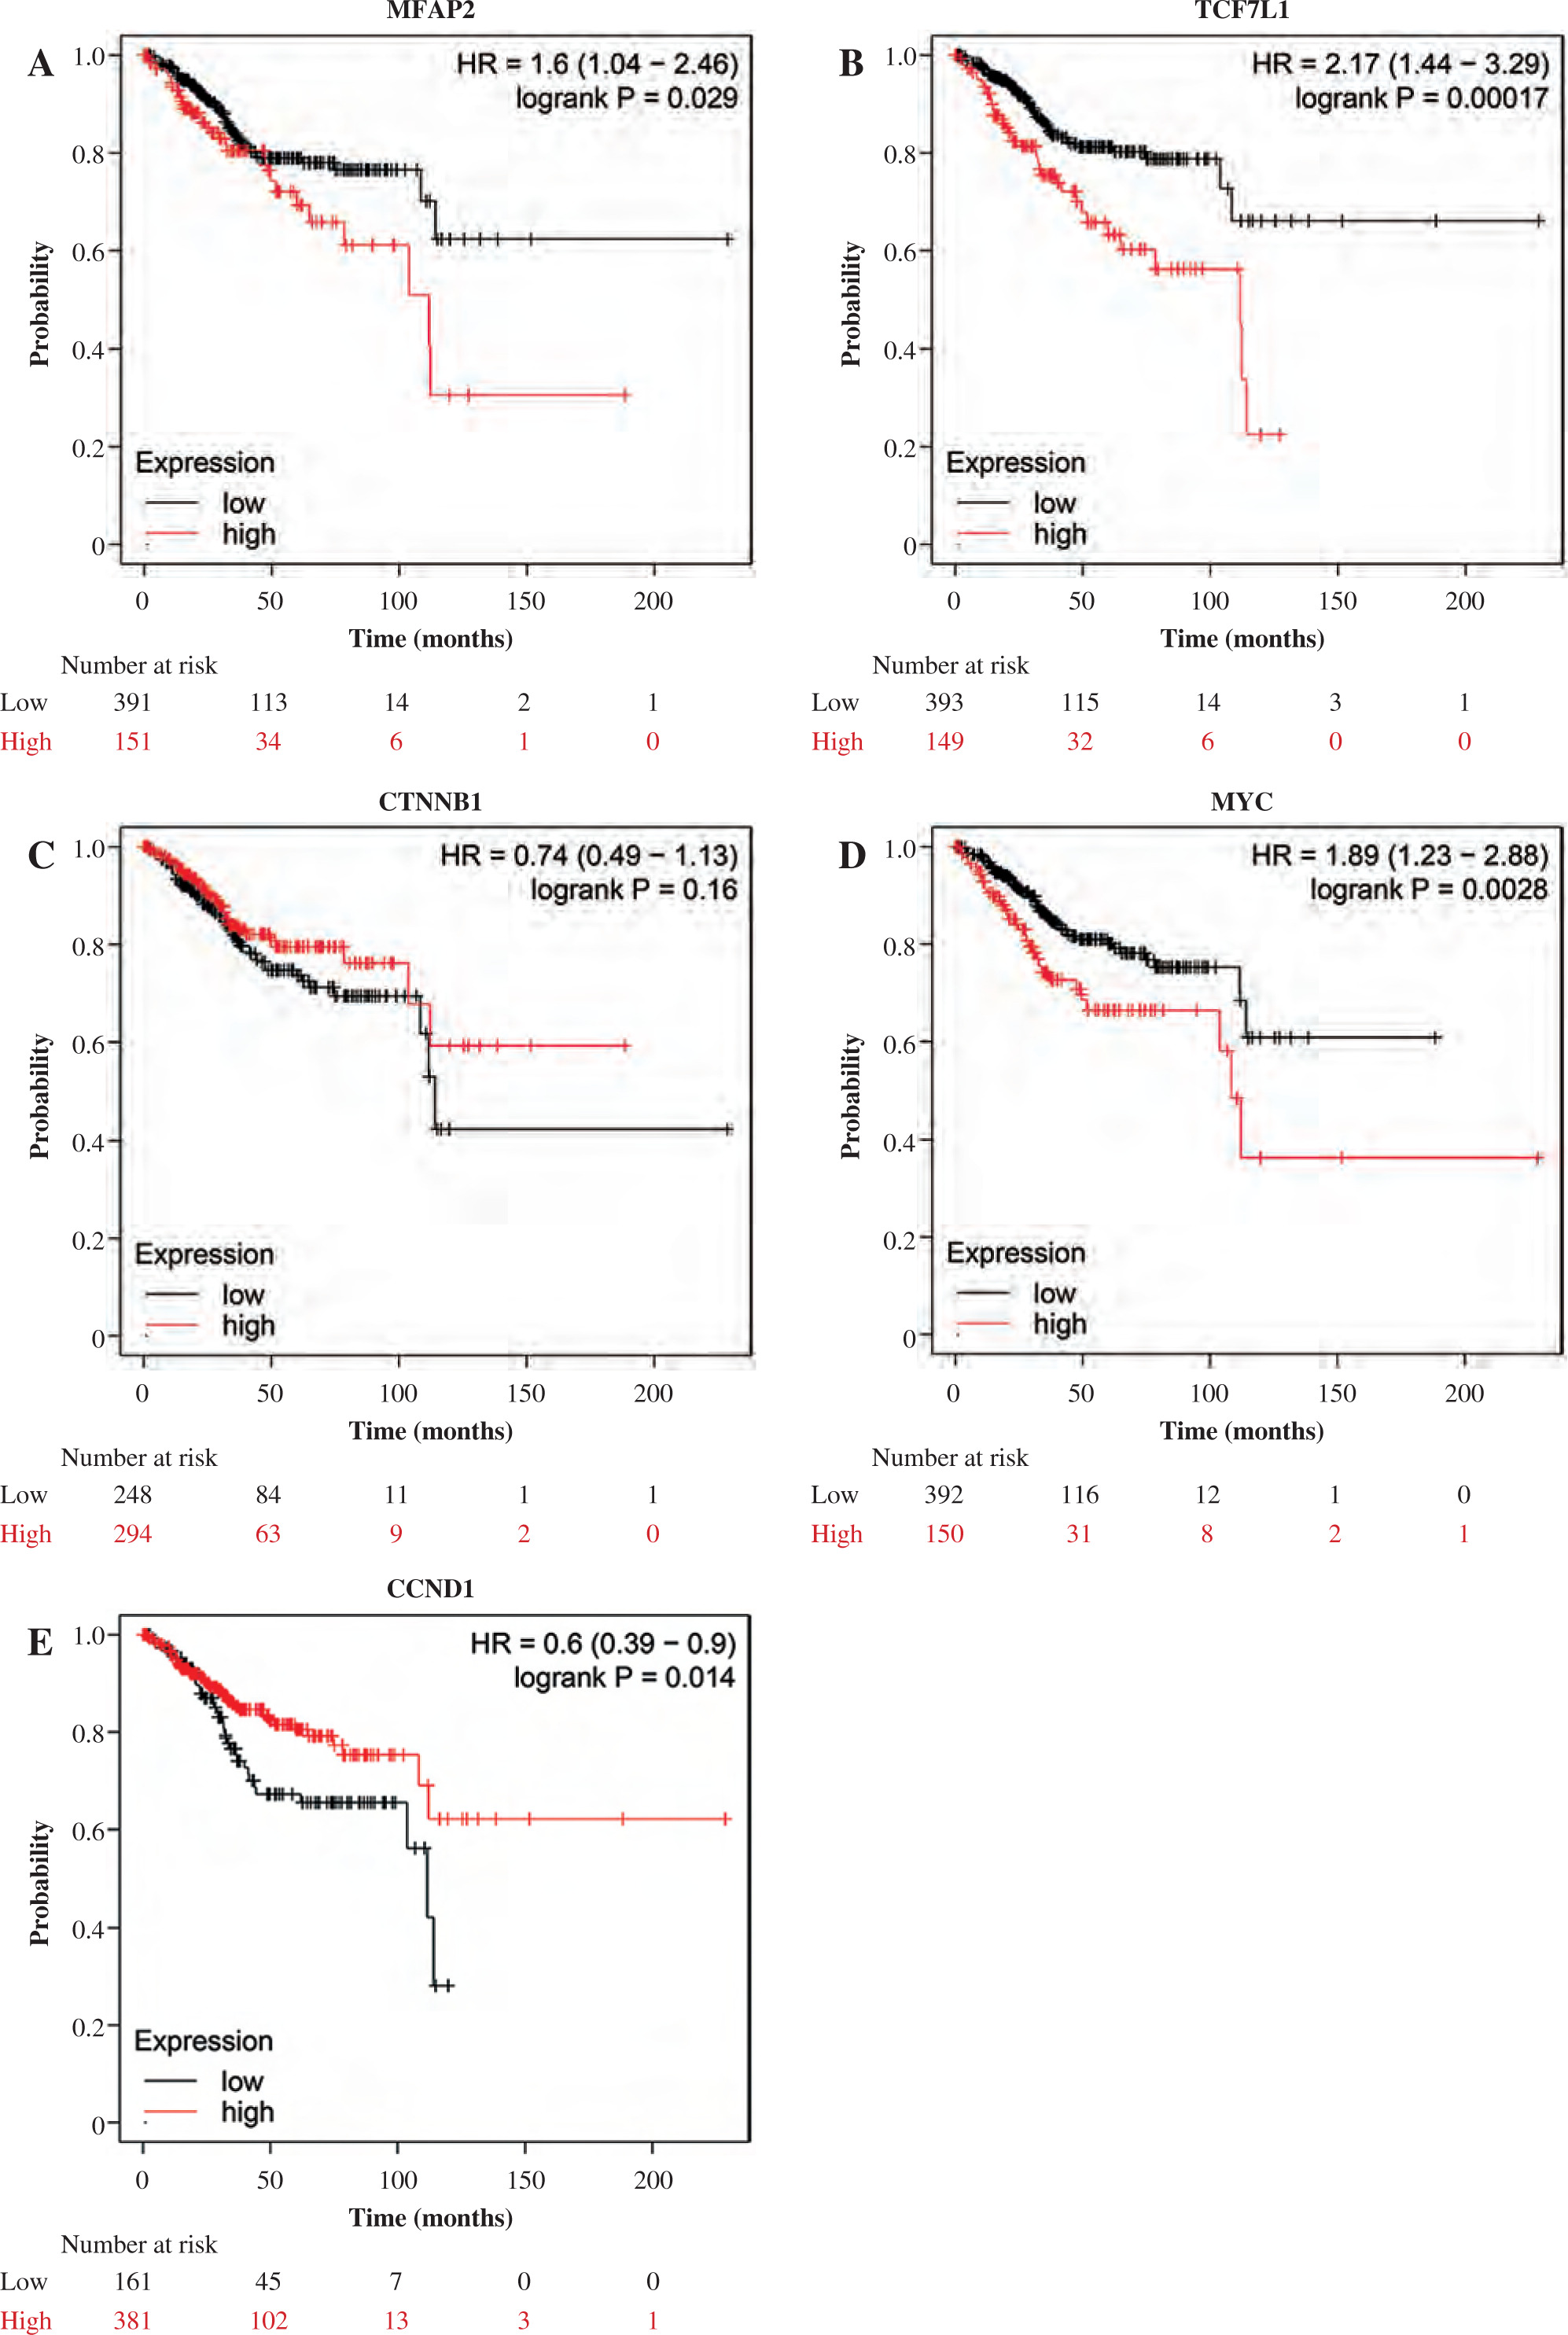
Fig. 6
The association of MFAP2 with immune infiltration in UCEC. Utilizing the ssGSEA algorithm (A), and the ESTIMATE algorithm (B) to investigate the association of MFAP2 with immune infiltration in UCEC patients using the TCGA database. The relationship between MFAP2 and 36 prevalent ICMs in UCEC is currently under investigation to validate the association between MFAP2 and immune cell enrichment (C)
TCF7L1 knockdown inhibits proliferation, migration, and invasion, and promotes apoptosis in RL95-2 and Ishikawa cells
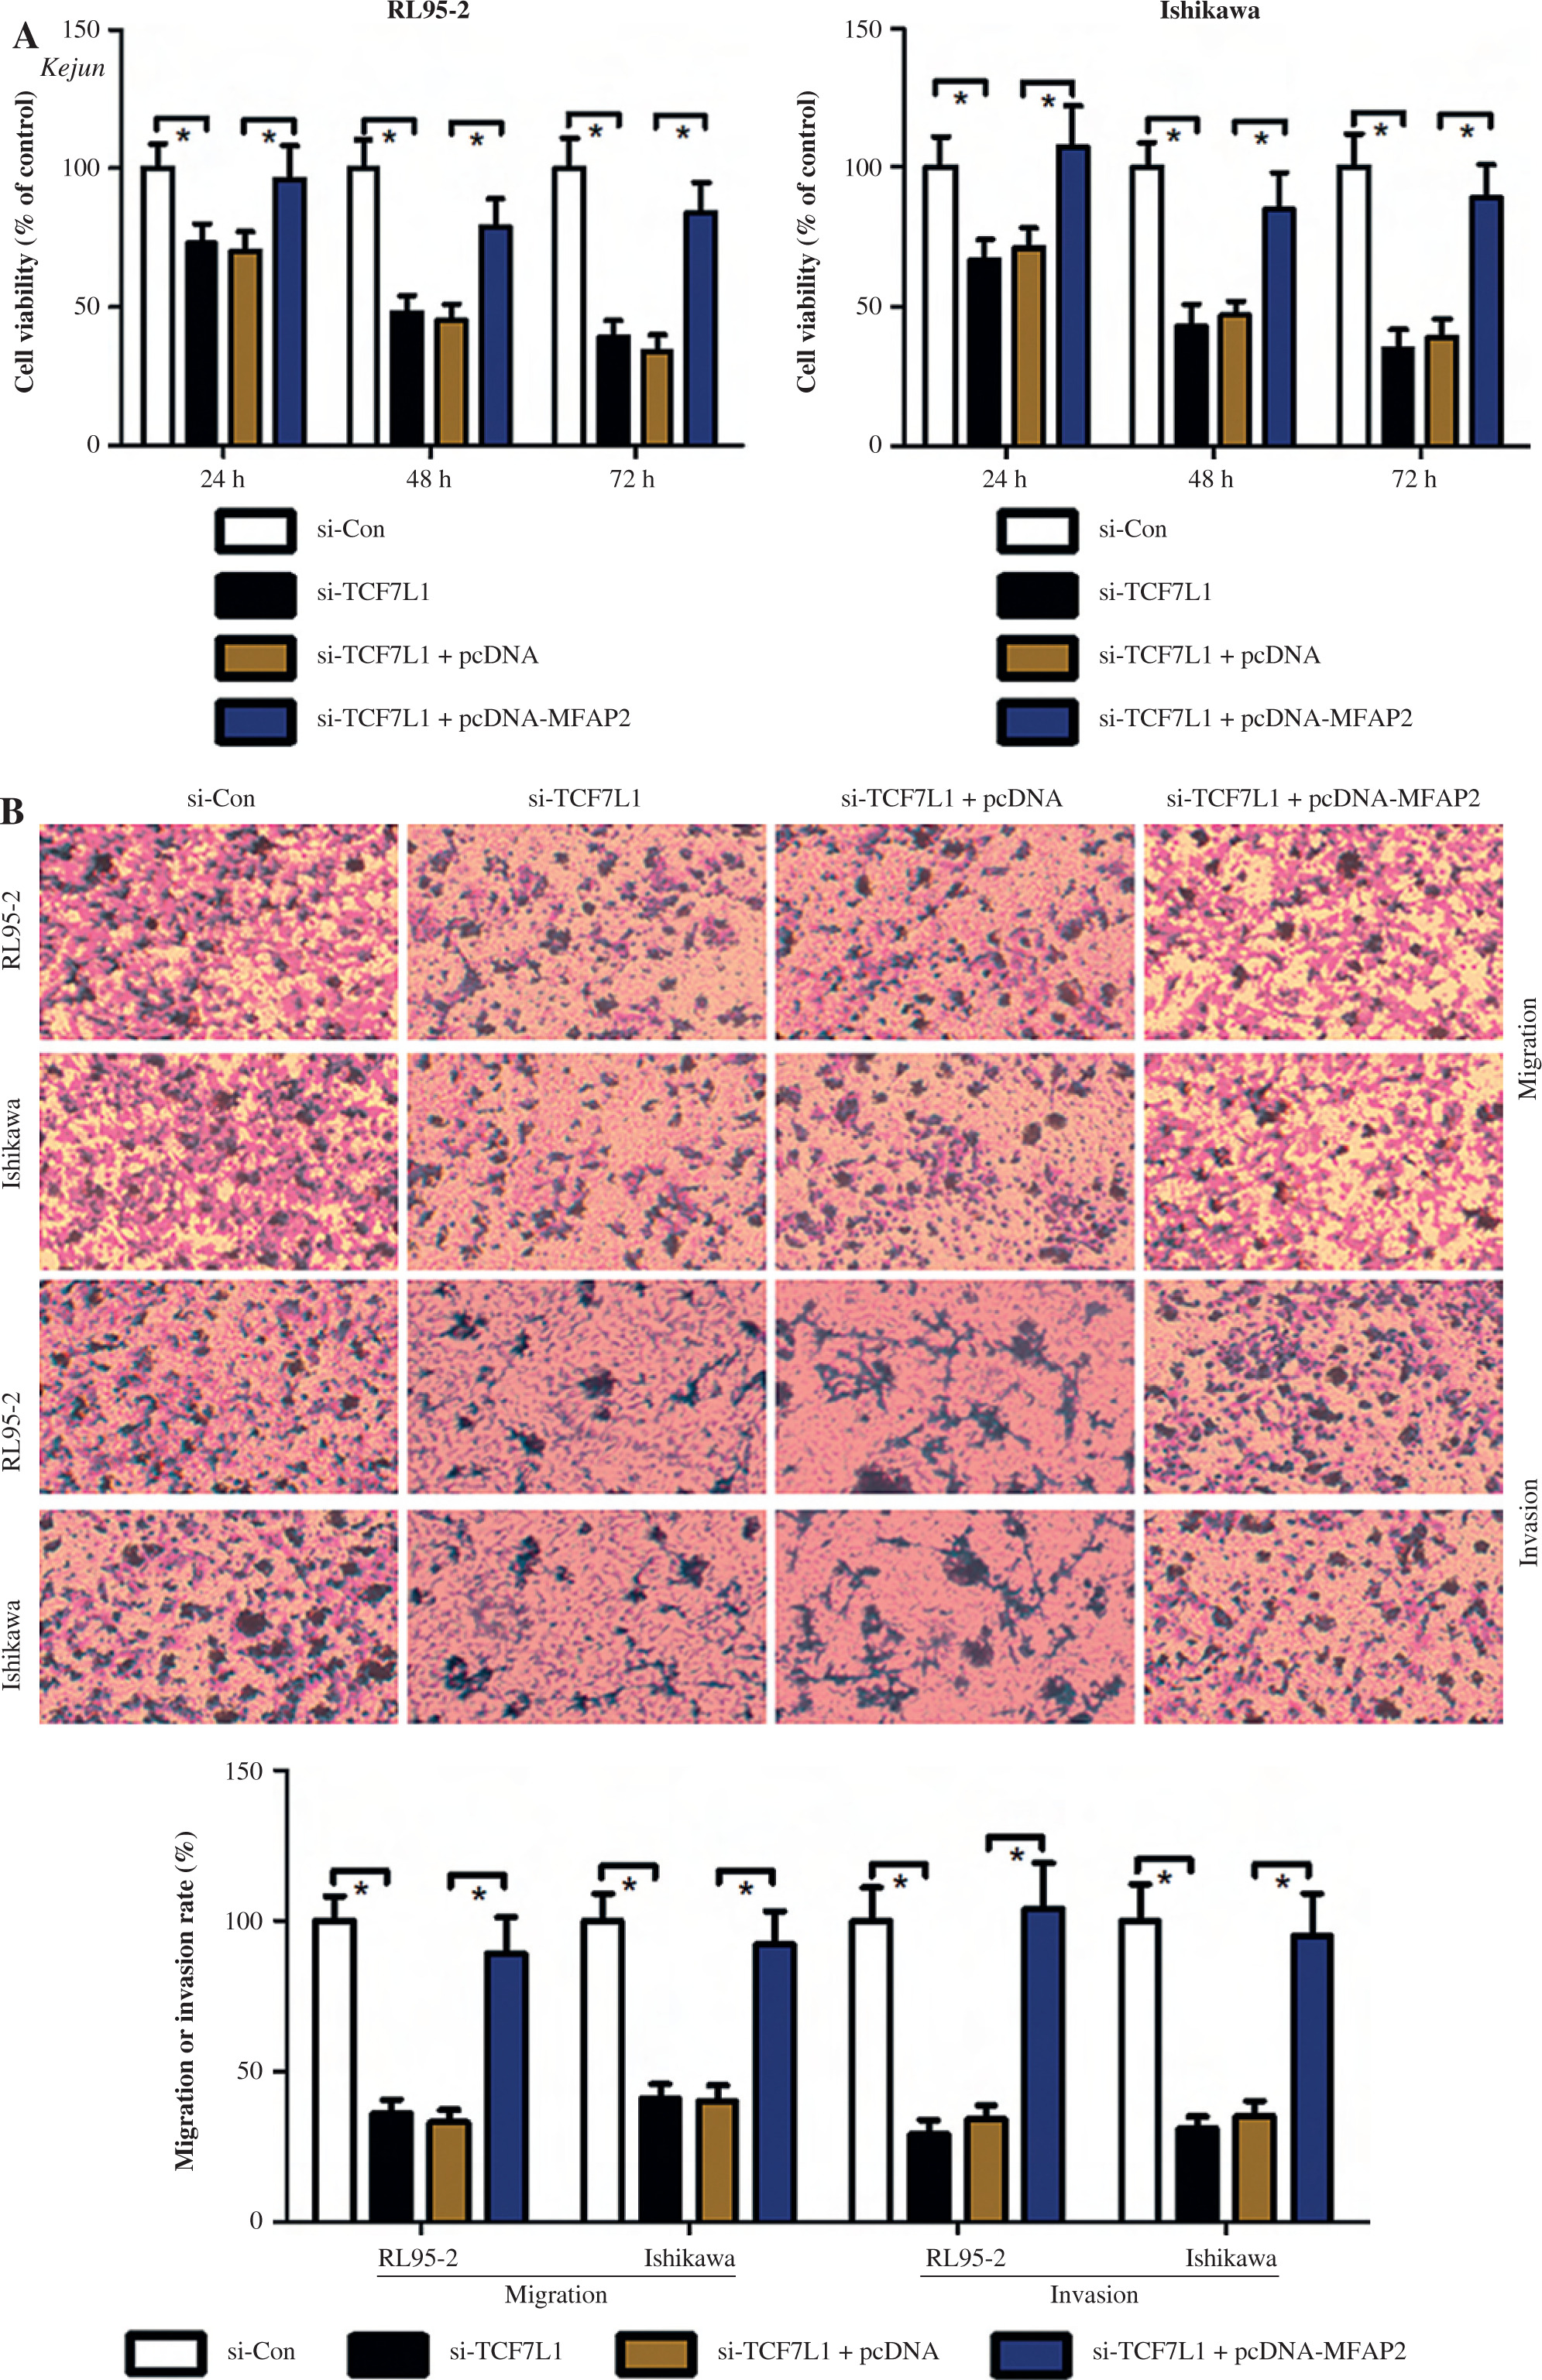
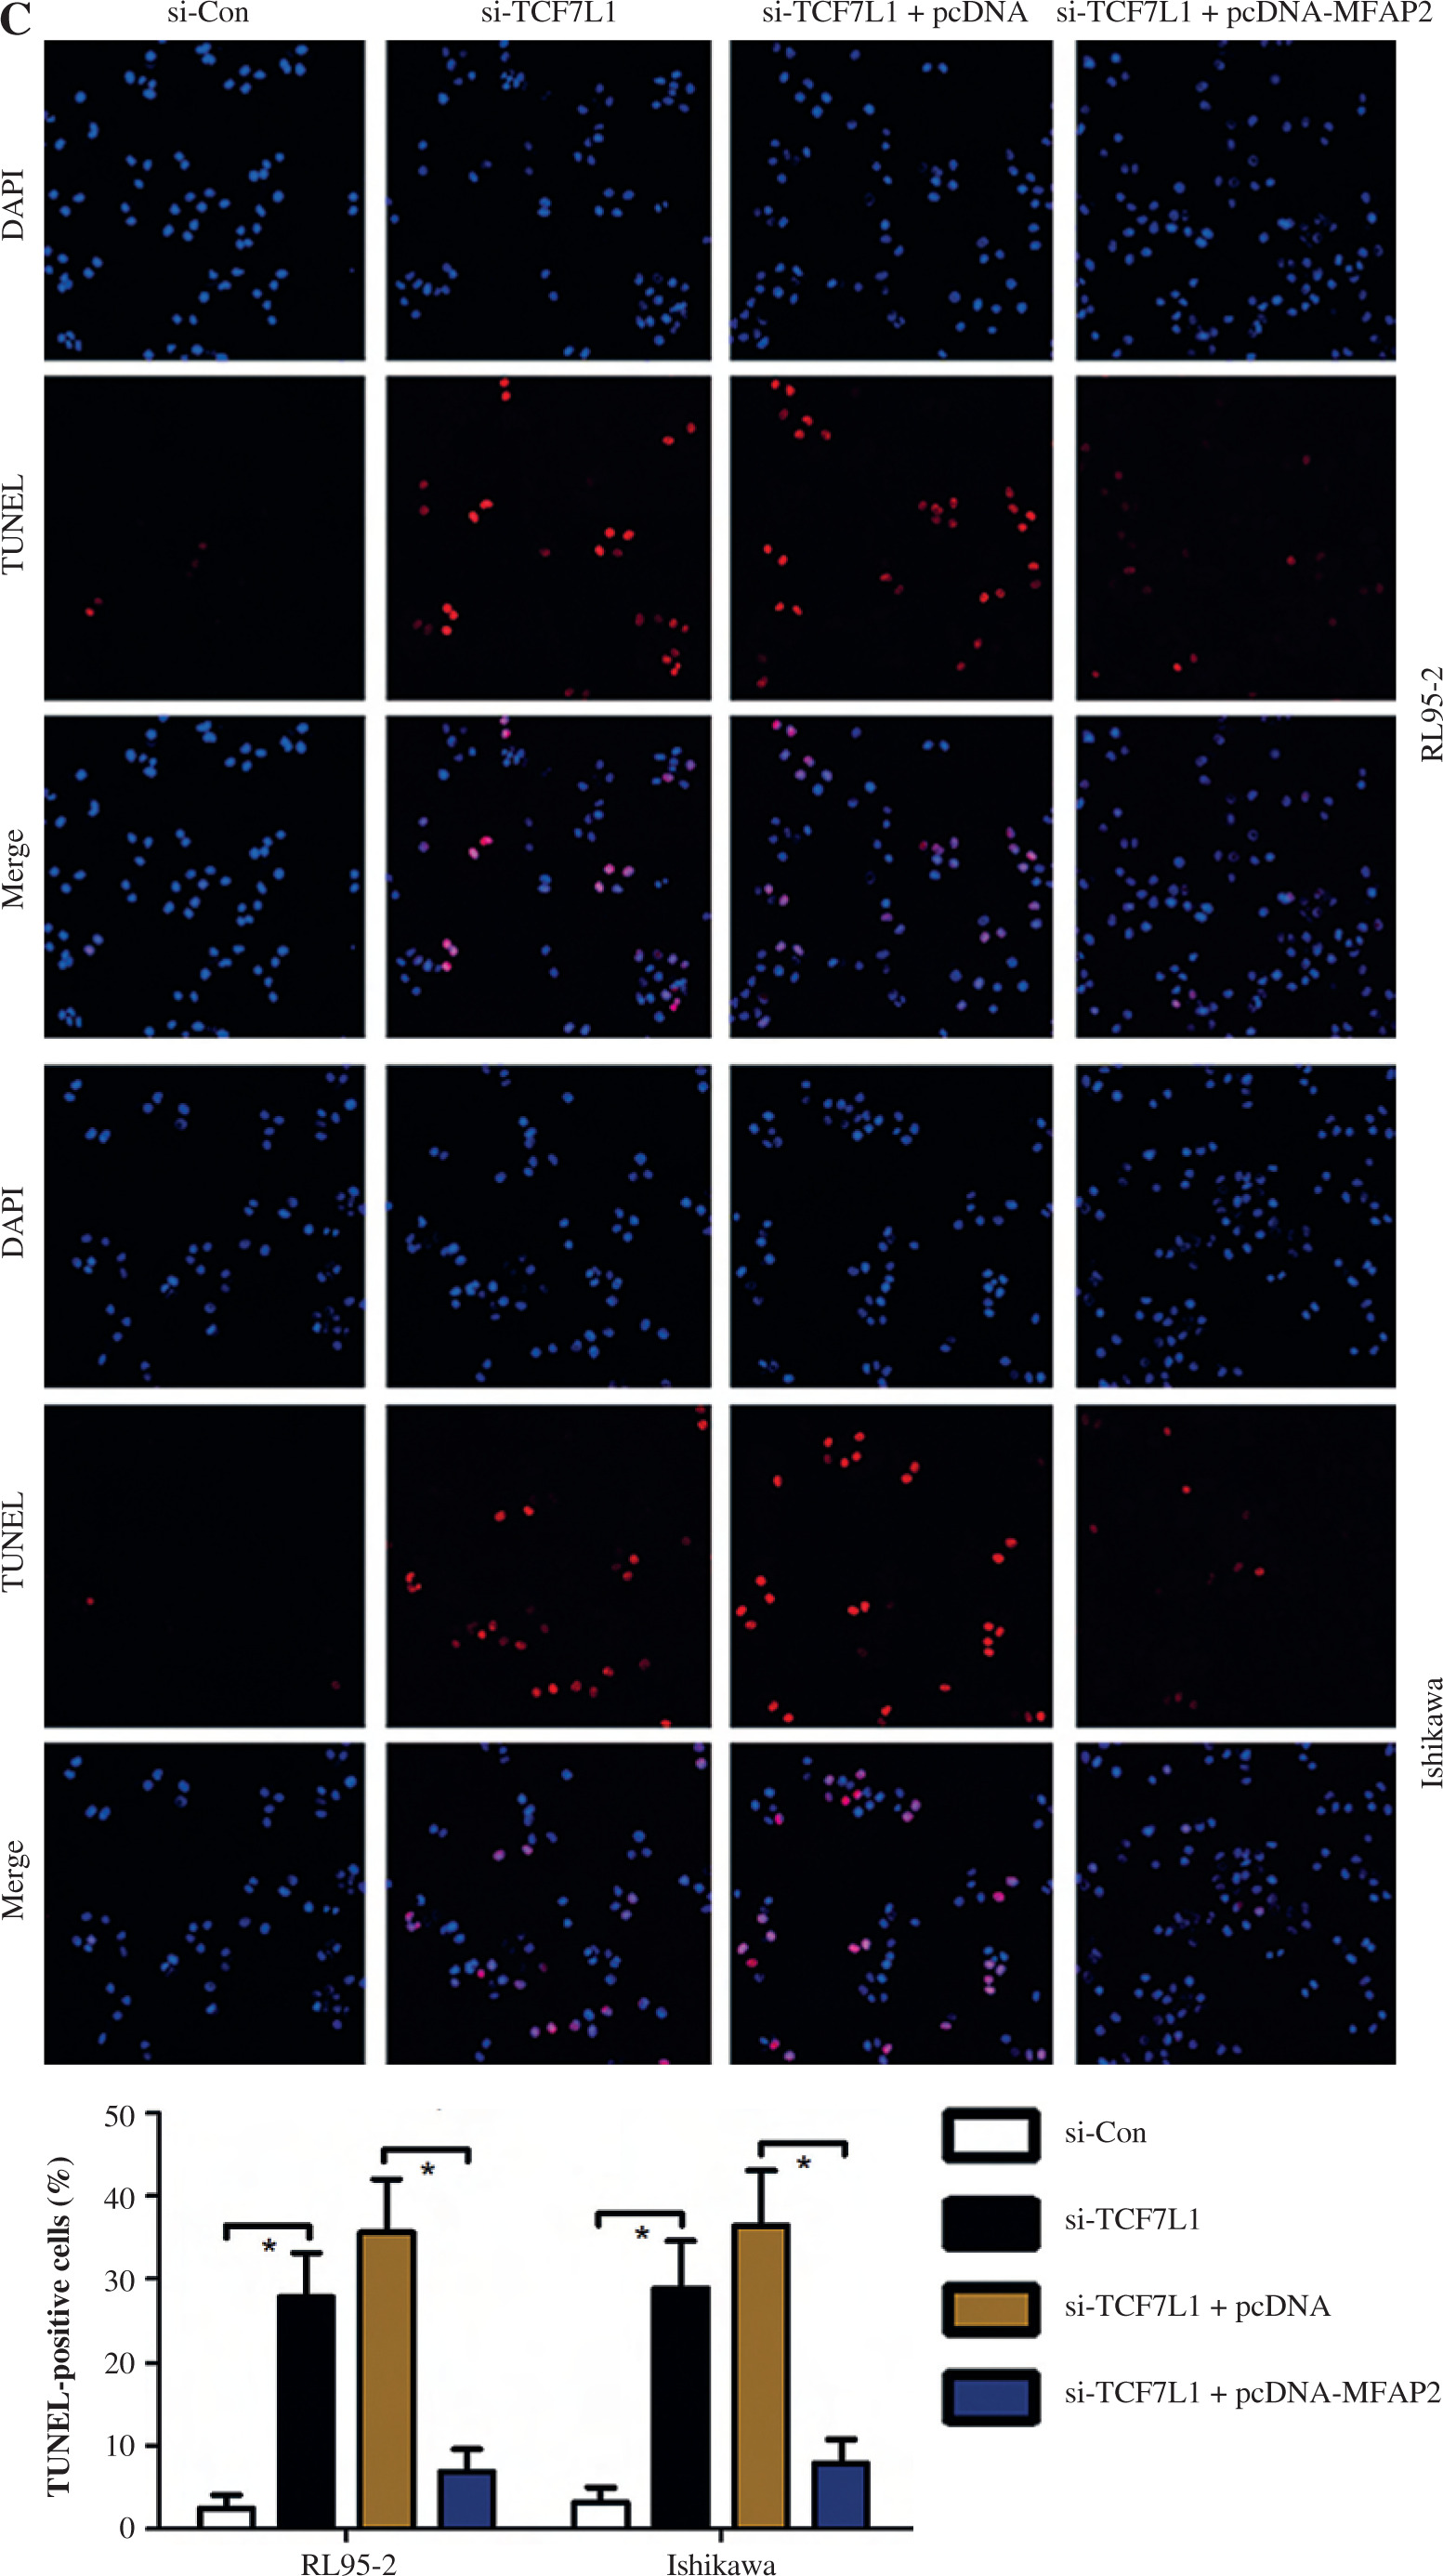
Based on the above findings, it was hypothesized that TCF7L1 upregulation is associated with the progression of UCEC. In vitro experimental procedures, including CCK-8, Transwell, and TUNEL assays, indicated that TCF7L1 knockdown suppressed tumor growth (Fig. 9A), inhibited cell migration and invasion (Fig. 9B), and accelerated cell apoptosis (Fig. 9C). However, the anti-tumor effect of TCF7L1 silencing on RL95-2 and Ishikawa cells was abrogated following cell transfection with MFAP2 overexpression plasmid (Fig. 9A-C).
Fig. 7
MFAP2 knockdown represses TCF7L1 and its downstream targets. A) After si-MFAP2 or si-Con transfection, β-catenin and TCF7L1 protein levels were measured in UCEC RL95-2 and Ishikawa cell lines using western blot. B) EMT markers, E-cadherin, N-cadherin, and ZEB2 protein levels were measured in UCEC RL95-2 and Ishikawa cell lines using western blot. C) c-Myc and CyclinD1 protein levels were measured in UCEC RL95-2 and Ishikawa cell lines using western blot. *p < 0.05 compared with si-Con group. n = 3 in each group
Discussion
It has been reported that MFAP2 upregulation can promote the progression of several types of human cancers, including gastric cancer, breast cancer, and melanoma, via potentiating cell proliferation, invasion, and migration [13, 35, 36]. A comprehensive bioinformatics analysis revealed that MFAP2 could serve as a novel diagnostic and prognostic indicator in gastric cancer [14]. Therefore, a better understanding of the tumor-promoting properties of MFAP2 could provide a prospective therapeutic target for human cancers. In the present study, analysis of the TCGA database and a cohort of patients with UCEC showed that MFAP2 was upregulated in UCEC. In vitro experiments demonstrated that MFAP2 knockdown could inhibit the proliferation, migration and invasion, and trigger the apoptosis of UCEC cells, thus suggesting that MFAP2 could be a potential anti-cancer target.
β-catenin, encoded by the CTNNB1 gene, is a key mediator of the canonical Wnt pathway and a transcriptional activator of the LEF/TCF transcription factor family [37]. The β-catenin/LEF/TCF complex mediates the transcription of genes involved in multiple signaling pathways, including EMT, cyclin D1, and c-Myc, which are involved in cancer progression [37-39]. In melanoma cells, MFAP2 knockdown significantly inhibited the protein expression levels of β-catenin and elevated the expression of the epithelial marker E-cadherin [13]. Herein, MFAP2 knockdown suppressed the β-catenin/TCF7L1 signaling axis in UCEC cells and hindered EMT via upregulating E-cadherin and downregulating N-cadherin and ZEB2. MFAP2 knockdown also inhibited the protein expression levels of c-Myc and cyclin D1 in UCEC cells. In addition, KEGG pathway analysis showed that TCF7L1 mediated the transcription of c-Myc and cyclin D1 to facilitate UCEC cell proliferation. These findings suggested a possible mechanism indicating that MFAP2 knockdown-mediated β-catenin/TCF7L1 signaling inactivation could impede UCEC progression via inhibiting c-Myc and cyclin D1.
TCF7L1, also known as TCF3, plays multifunctional roles in stem cell pluripotency, cerebral development, and cardiomyocyte differentiation [40-42]. Emerging evidence has suggested that TCF7L1 is also involved in tumorigenesis and could therefore be considered as a potential therapeutic target for cancer [43, 44]. For example, TCF7L1 could modulate the suppression of the self-renewal capaci- ty of liver cancer stem cells [43]. In addition, TCF7L1 could drive tumor growth and cell migration, and override senescence in skin squamous cell carcinoma [44]. Herein, analysis of the TCGA database and patients with UCEC revealed that TCF7L1 was significantly upregulated in UCEC tissues. Additionally, TCF7L1 knockdown inhibited the proliferation, migration, and invasion, and promoted the apoptosis of RL95-2 and Ishikawa cells. However, MFAP2 overexpression neutralized the anti-tumor effect induced by TCF7L1 downregulation in RL95-2 and Ishikawa cells. Pearson correlation analysis indicated that the expression of MFAP2 was positively associated with that of TCF7L1 in UCEC tissues. These findings suggested that MFAP2 could mediate the TCF7L1 axis to promote the progression of UCEC. In addition, TCF7L1 upregulation was associated with poor overall survival in patients with gastric cancer [45]. In patients with UCEC, the increased expression of TCF7L1 conferred a shorter survival time compared with patients with low TCF7L1 expression.
Fig. 8
MFAP2 knockdown results in inhibition of proliferation, migration, and invasion and an increase in apoptosis. MFAP2 mRNA and protein expression were measured in endometrial stromal cell line hESC and UCEC cell lines RL95-2, HHUA, and Ishikawa using RT-PCR and western blot, respectively (A). After si-MFAP2 or si-Con transfection, cell proliferation, migration, and invasion, and apoptosis were evaluated using CCK-8 (B) Transwell (C) and TUNEL (D) assay, respectively. *p < 0.05, **p < 0.01, ***p < 0.001 compared with corresponding control group. n = 3 in each group
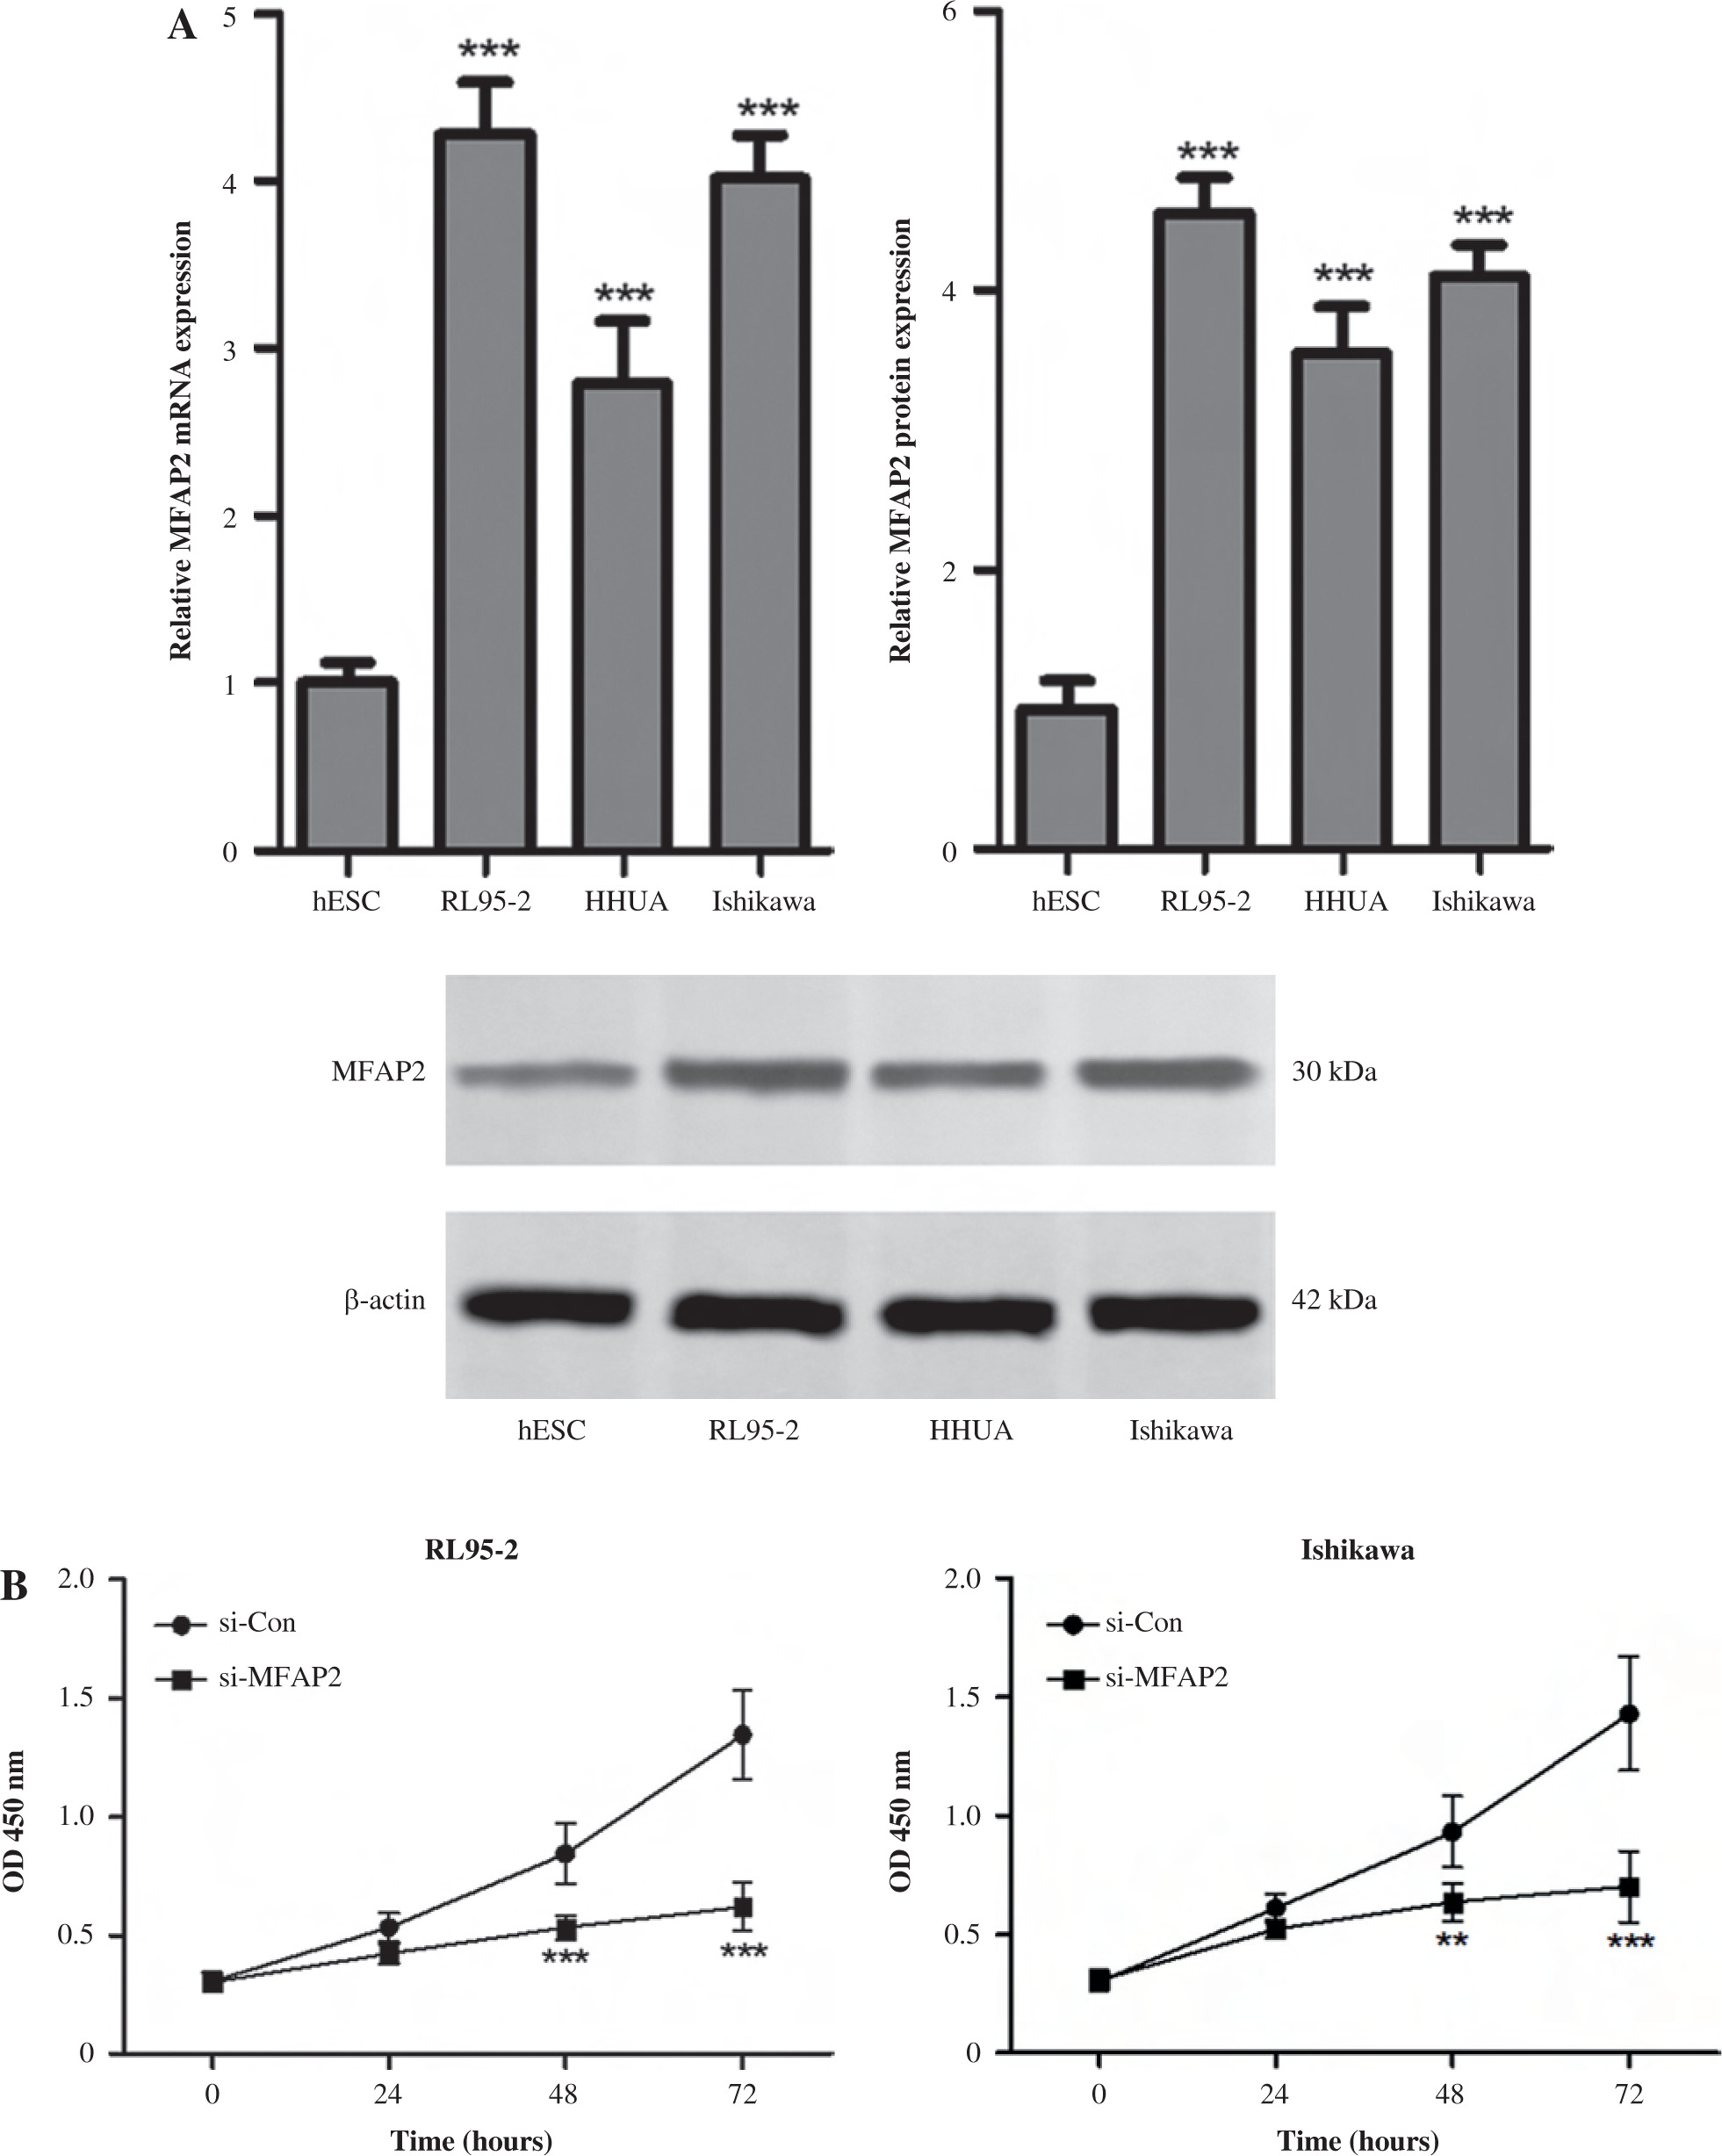
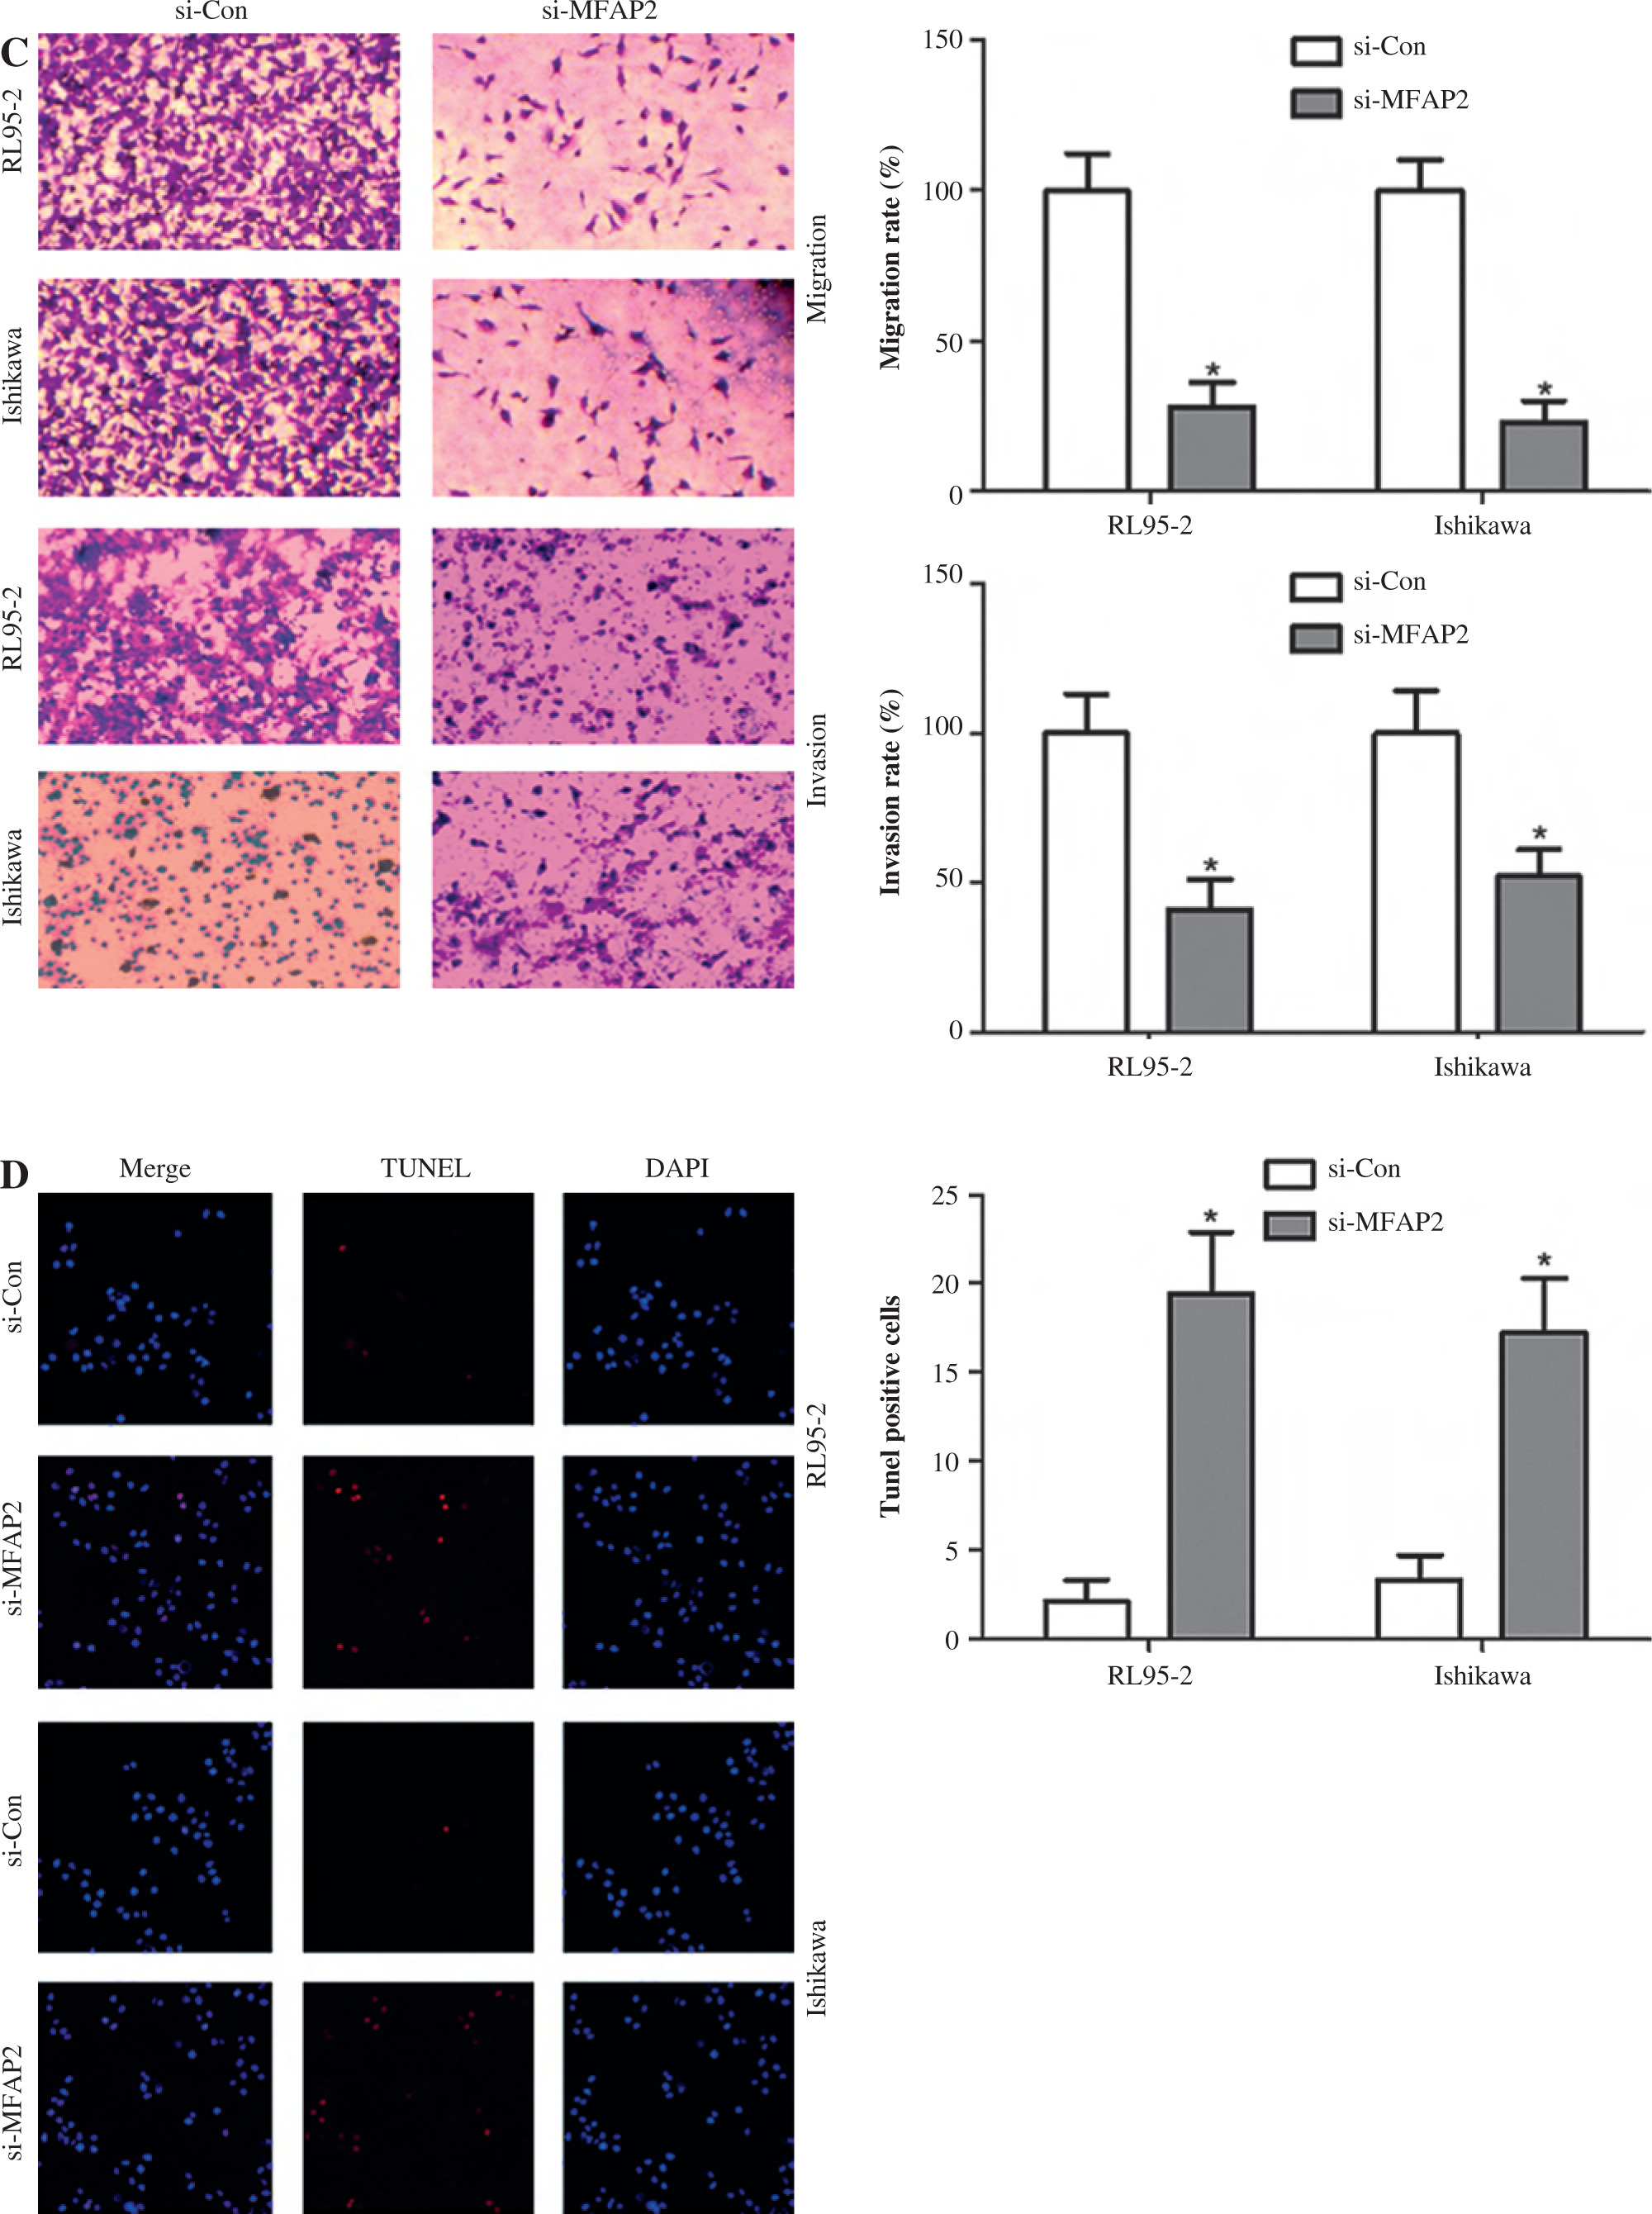
Fig. 9
TCF7L1 knockdown inhibits proliferation, migration, and invasion and promotes apoptosis in RL95-2 and Ishikawa cells. After co-transfection with si-TCF7L1 and MFAP2 overexpression plasmids, cell proliferation, migration and invasion, and apoptosis were evaluated using CCK-8 (A), Transwell (B); *p < 0.05, n = 3 in each group After co-transfection with si-TCF7L1 and MFAP2 overexpression plasmids, cell proliferation, migration and invasion, and apoptosis were evaluated using TUNEL (C) assay; *p < 0.05, n = 3 in each group
The TME exhibits a favorable immune state with abundant immune cell infiltration, leading to improved patient prognosis [46]. The Immunoscore can quantify T-cell infiltration in situ and has been demonstrated to outperform the AJCC/UICC TNM classification for colorectal cancer patients [47]. The Immunoscore serves as an independent predictor for recurrence and survival in colon cancer patients, surpassing the prognostic capability of tumor TNM stage, differentiation degree, and MSI status [48, 49]. The Immunoscore has not been previously reported in UCEC. Our study revealed a negative correlation between MFAP2 and Immunoscore. Thus, MFAP2 overexpression may contribute to immunosuppression in UCEC patients.
Our research still has some limitations. Firstly, we have not clearly elucidated the direct or indirect relationship between MFAP2 and TCF7L1. Secondly, we have not validated the effects of MFAP2 and TCF7L1 on tumor growth in in vivo models. Finally, we have not explored in depth the impact of MFAP2 and TCF7L1 on the TME in in vivo models.
Conclusions
The results of the current study suggested that the novel MFAP2/CTNNB1/TCF7L1 signaling axis could be involved in the tumorigenicity of UCEC. MFAP2 or TCF7L1 knockdown displayed excellent antineoplastic activities in vitro, thus suggesting that MFAP2 and TCF7L1 could be promising therapeutic targets for preventing UCEC progression.
Availability of data and materials statement: The data that support the findings of this study are available on request from the corresponding author. The data are not publicly available due to privacy or ethical restrictions.