Introduction
22q11.2 deletion syndrome (DiGeorge syndrome – DGS) is the most common microdeletion syndrome, with a prevalence of 1 : 3000 to 1 : 6000 live births [1]. It is known as a T-lymphocyte disorder. However, the type, recurrence and duration of some infections are not always related to T-lymphocyte number and function [2]. There is evidence that B lymphocyte functional deficiency, hypo-gammaglobulinemia, and innate immunity alterations are associated with more severe infections in DGS patients [2].
DiGeorge syndrome patients require lifelong monitoring for immune dysregulation and other immune defects although T-cell lymphopenia mostly improves with age [3]. Autoimmune disorders such as hypo/hyperthyroidism and immune cytopenias are also common in DGS patients [2]. In the context of innate immunity, these patients appear to have normal numbers of natural killer (NK) cells, although NK cell functions have not been fully explored [4]. In addition, phagocytic function of immune cells and adhesion molecules on neutrophils and lymphocytes have not yet been investigated in DGS patients. It has been previously reported that decreased T-cells may be due to increased apoptosis, but it has not been investigated in detail. Some authors believe that increased Fas expression on lymphocytes in DGS patients may contribute to the pathophysiology of the 22q11.2 del [5].
In the present study, we investigated the B-cell compartment (serum immunoglobulins, specific antibodies against vaccines, memory B-cells and other B-cell subsets), factors predisposing to autoimmunity (autoantibodies, NKT cells, T regulatory cells, CTLA-4, Fas and Fas ligand (FasL) expressing cells) and basic parameters for innate immunity (NK cells, NK-cell specific cytotoxicity, phagocytic functions and adhesion molecules) in a cohort of 35 DGS patients, aiming to identify immune alterations other than T-cell defects.
Material and methods
Thirty-five pediatric patients diagnosed with 22q11.2 deletion syndrome and 20 healthy controls without acute or chronic disease who were followed up between 2014 and 2023 at the Second Department of Pediatric Immunology were included in the study. The diagnosis of the patients was confirmed by demonstrating the 22q11.2 deletion with fluorescence in situ hybridization (FISH) [6]. Parameters directly affected by intravenous immunoglobulin (IVIG) treatment were obtained retrospectively from the medical records of the patients before IVIG. Parameters not affected by IVIG were obtained prospectively. There was no significant difference in sample collection time between the study and control groups regarding gender and age.
Investigations for B-cells and humoral immunity
Serum immunoglobulins
Serum immunoglobulin levels (IgG, IgM, IgA) were determined using the nephelometric technique (by Dade Behring BN2 Nephelometer, Germany) and were defined as low when immunoglobulin levels were more than two standard deviations (SD) below the mean value for age [7]. Dade Behring commercially available immunoglobulin kits were used in determinations.
B lymphocyte subsets
B lymphocyte subset immunophenotyping was performed by Beckman Coulter Gallios flow-cytometer and BC Kaluza Analysis Software using the erythrocyte-lysed whole blood procedure. The monoclonal antibodies (CD45 KRO (B36294-BC), CD19 ECD (A07770-BC), CD27 FITC (BD340424), CD21 PB (B09982-BC), CD38 APC-H7 (BD653314), IgD PE (B30653), and IgM APC (B30654)) were used by conjugating as follows: CD19 for B-lymphocytes, CD19+CD21+CD27– cells for naive B-lymphocytes, CD19+CD27+ cells for total memory B-lymphocytes, CD19+CD27+IgD+IgM+ cells for non-switched memory B-cells, CD19+CD27+IgD–IgM– cells for switched memory B-cells, CD19+CD21–CD38high cells for immature transitional B-lymphocytes, CD19+CD21–CD27– cells for immature B-lymphocytes, CD19+IgM–CD38high for plasmablasts and CD19+CD21lowCD38low cells for active B lymphocytes. Absolute numbers of lymphocytes were calculated by using leukocyte counts in hemogram tests and lymphocyte percentages in peripheral blood smears. Values were considered low when the B-lymphocyte subset percentage and count were below 2 SD of the mean value of healthy individuals.
Investigations for autoimmunity
Evaluation of autoantibodies
Antinuclear antibody (ANA) and anti-neutrophil cytoplasmic antibody (ANCA) positivity in serum was detected by the immunofluorescence (IF) technique. ANA subsets, AMA-M2, anti-ribosomal P protein, anti-histone, anti-nucleosome, anti-dsDNA, anti-PCNA, anti-centromere B, anti-Jo-1, anti-PM-Scl, anti-Scl-70, anti-SSB, anti-Ro-52, anti-SSA, anti-SM, anti-RNP, DFS70, liver kidney micro-somal antibody, anti-smooth muscle antibody, anti-parietal antibody, and anti-mitochondrial antibody were all examined by immunoblot assay (Euroimmun, Germany). Anti-thyroglobulin, anti-thyroid peroxidase antibodies, rheumatoid factor (RF) and direct Coombs test results were obtained from medical records of patients.
NKT (CD3+CD16+CD56+) cells
The absolute numbers of lymphocytes were calculated based on total leukocyte counts and differential white blood cell counts using Wright staining of blood smears and conventional light microscopy. NKT cells (CD3+-CD16+CD56+) were determined by corresponding monoclonal antibodies and flow cytometry (Becton Dickinson (BD) FACSCanto II and BD FACSDiva Software).
Treg cells (CD3+CD4+CD25+Foxp3+ CD127lowCD194+ (CCR4))
For the intracellular detection of Foxp3, heparinized blood was first stained with appropriate monoclonal antibodies and dyes for cell surface markers: CD3 FITC (BD345763), CD4 FITC (BD566320), CD25 APC (BD561399), CD127 BV421 (BD562436), CD194 BV510 (BD563066) (CCR4), CD45RO Percp Cy5.5 and HLADR APC-H7 (BD561358). Then, cells were washed in PBS containing FBS and 0.1% sodium azide. After washing, cells were fixed and permeabilized (permeabilizing buffer, cat. No. 560098) with the appropriate buffers and then stained with intracellular PE-conjugated anti-Foxp3 (clone 259 D/C7) antibody (BD Pharmingen) according to the manufacturer’s protocol. Gating strategy and determination of Treg frequencies were established as published before [8] and a BD FACSCanto II flow cytometer and BC Kaluza Analysis Software were used. Total Treg cells (CD3+CD4+ CD25+Foxp3+CD127lowCD194+), memory Treg cells (CD3+CD4+CD25+Foxp3+CD127low-CD45RO+CD194+), naive Treg cells (CD3+CD4+CD25+-Foxp3+CD127lowCD45RO-CD194+) and active Treg cells (CD3+CD4+CD25+Foxp3+CD127lowHLADR+CD194+) were calculated in frequencies and absolute numbers.
CTLA-4 (CD152) intracellular expression on CD3+CD4+CD25+ and CD3+CD8+CD25+ lymphocytes and intracellular expression on Treg (CD3+CD4+CD25+FOXP3+CD127–) cells
The method is the same as for the above three lymphocyte subgroups and it was defined for activated T helper cells as follows: heparinized whole blood (100 µl) was stained with anti-CD3, anti-CD4, and anti-CD25 monoclonal antibodies (BD, USA), and erythrocytes were incubated with 2 ml of lysing solution (BD) for 10 min. After washing with PBS solution containing 0.1% bovine serum albumin, leukocytes were suspended in FACS permeabilizing solution for 10 min. The cells were stained with PE-conjugated anti-CD152 (CTLA-4) monoclonal antibodies for 30 min, rinsed and resuspended in PBS-BSA. For activation, cells were stimulated with PMA-ionomycin for 16 hours. The number of cells that were positive for intracellular CD4+CTLA-4+ was expressed as a percentage of CD3+ gated cells using a BD FACSCanto II flow cytometer and BC Kaluza Analysis Software. Then, we evaluated CTLA-4 expression in basal and post-activation conditions and compared them. We compared them not only by using percentages but also with mean fluorescence intensity (MFI).
CD28 surface expression on CD3+CD4+CD25+ and CD3+CD8+CD25+ lymphocytes
Percentages of CD3+CD4+CD25+CD28+ and CD3+-CD8+CD25+CD28+ lymphocytes were analyzed according to the cell surface staining instructions in heparinized blood samples and by using a BD FACSCanto II flow cytometer and BC Kaluza Analysis Software.
Fas (CD95) and FasL (CD95L=CD178) expression
Fas and FasL expression levels on naive CD8+-cells (CD3+CD8+CD45RO–CD178+ and CD3+CD8+-CD45RO–CD95+), on memory CD8+ cells (CD3+CD8+-CD45RO+CD178+ and CD3+CD8+CD45RO+CD95+), and on active CD8+ cells (CD3+CD8+HLA-DR+CD178+ and CD3+CD8+HLA-DR+CD95+) were examined on freshly isolated mononuclear cells with different monoclonal antibodies (CD3 FITC (BD345763), CD4 V450 (BD560811), CD8 Percp Cy5.5 (BD565310), CD45RO Percp Cy5.5 (BD560607), HLADR APC-H7 (BD561358), CD95 PE (BD340480), CD178 APC (BD564262)) and by using flow cytometry (BD FACSCanto II flow cytometer and BC Kaluza Analysis Software), as reported previously by Gupta et al. [9] and Böhler et al. [10]. We also used flow cytometric analysis in order to examine comparatively Fas and FasL expression on peripheral naive, memory, and active CD4+ cells by following the instructions of the manufacturer as described above for CD8+ cells. We did not measure FasL in serum by the ELISA technique.
Investigations for innate immunity
Lymphocyte subsets and natural killer cell (NK) counts
Percentages and absolute counts of lymphocyte subsets (CD3+, CD19+, CD3+CD4+, CD3+CD8+) and natural killer cells (CD3-CD16+CD56+) were investigated by flow cytometry, FACSCanto II and the 6-color TBNK Multitest (BD 644611).
Cytotoxic activity of NK cells
In order to quantify the cytotoxic activity of NK cells, K562 target cells were cultured and labeled with DIOC18 (3,3′-dioctadecyloxacarbocyanine perchlorate, Life Technologies, USA), which is a lipophilic green fluorescent membrane dye, as described previously [11]. Then, K562 cells (100 ml) were incubated with effector mononuclear cells (100 µl) at a 1 : 25 target/effector cell ratio for four hours. These effector cells were obtained from fresh heparinized blood by density gradient centrifugation on commercial separating solution, namely Biocoll, Biochrom GmbH. The percentages of target cells killed by effector cells and live cells were determined by flow cytometry. Another tube with a 1 : 25 target/effector cell ratio including 30 µl of interleukin 2 (200 U/ml) was used as a positive control tube. DNA staining solution (50 µl per tube) was used to stain for cell viability. All the dead and live cell populations were measured using a Beckman Coulter Gallios flow cytometer and analyzed with BC Kaluza Analysis Software.
Oxidative burst activity of monocytes and granulocytes (Phagoburst test)
The quantification of the oxidative burst activity of monocytes and granulocytes in peripheral blood was determined by the Phagoburst test, Orpegen Pharma, Heidelberg, Germany. By means of this test, we determined the percentage of phagocytic cells which produce reactive oxidants in the presence of some stimulants such as opsonized bacteria Escherichia coli, fMLP (n-formyl-methionine-leucine-phenylalanine) and PMA (phorbol-12-myristate-13-acetate) and cells’ enzymatic activity.
CD11a and CD18 surface expression on neutrophil granulocytes and lymphocytes
Surface expression levels of CD11a and CD18 on lymphocytes and granulocytes were analyzed by flow cytometry and cell surface staining using anti-CD11a PE (BD555384) and anti-CD18 FITC (BD347953) monoclonal antibodies (BD, USA) in peripheral heparinized blood. Lymphocytes and neutrophils were gated based on their forward and side scatters and were assessed using BD FACSCanto II and BD FACSDiva Software. Mean fluorescence intensity (MFI) values were also used in the analysis. To account for background fluorescence and nonspecific binding, the MFI values of target antibody-stained cells were normalized by dividing them by the MFI values obtained from the corresponding isotype control-stained cells (target/isotype).
Flow cytometry figures showing the gating strategy of all analyses are presented in the supplementary file.
Statistical analysis
The data were evaluated using SPSS Statistics for Windows version 25.0 (IBM Corp., Armonk, NY, USA) and by analyzing descriptive statistics (median, minimum, maximum and percentage). A p-value of < 0.05 was considered significant for all analyses, and relationships were evaluated with 95% confidence intervals. The means of normally distributed data for dual groups were compared using Student’s t-test. The Mann-Whitney U test was used for non-normally distributed variables. The chi-square test was used to compare categorical variables.
Results
There were 35 patients, 16 (45.8%) of whom were female. The mean age of the patients was 84.4 ±57.8 months, and the median age was 68 (IQR 48-120 months). The mean and median age of patients at diagnosis was 34.2 ±48.5 and 10 months (IQR 3-42 months), respectively. Eight (40%) of the 20 healthy children in the control group were female. The mean age of the healthy children was 111 ±46.8 months, and the median age was 97.5 (IQR 78-159 months).
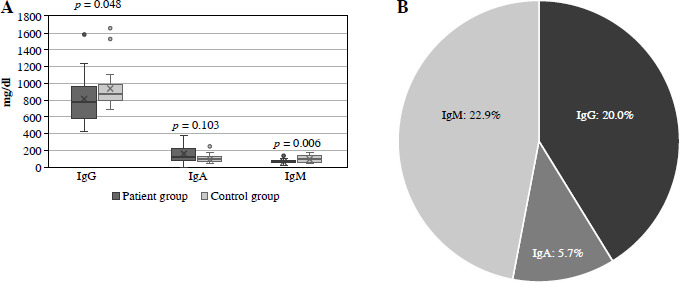
Serum immunoglobulin levels of DGS patients (n = 35) and healthy children (n = 20) were compared, and DGS patients had significantly lower IgG and IgM levels (p = 0.048 and 0.006, respectively) (Fig. 1A). In addition, all patients were evaluated individually to determine whether they had normal, low, or high serum immunoglobulin levels. IgG values of 20% and IgM values of 22.9% of the patients were 2 SD below the normal range (Fig. 1B).
Fig. 1
A) Comparison of serum immunoglobulins (mg/dl) between patient and control group. B) Percentages of patients with low immunoglobulin levels (< –2 SD)
Percentages and absolute counts of B-cell subsets were also compared between study and control groups. Total memory B-cells (CD19+CD27+), non-switched memory B-cells (CD19+CD27+IgD+IgM+) and switched memory B-cells (CD19+CD27+IgD–IgM–) were significantly low in DGS patients (p = 0.000, 0.001, and 0.002, respectively) (Table 1A). In contrast, both percentages and absolute counts of immature transitional B-cells (CD19+CD21–CD38high), immature B-cells (CD19+CD21–CD27–), plasmablasts (CD19+IgM–CD38high), and active B-cells (CD19+CD21lowCD38low) were found to be significantly high in the patient group (Table 1A). When the B-cell subsets of each patient were compared with age-matched normal values, 57.2% of patients had low non-switched memory B-cells, and 22.8% had low switched memory B-cell values (Table 1B).
Table 1A
Comparison of percentages and absolute counts of B cell subsets between patient and control groups
Table 1B
Numbers and percentages of patients with normal, high, and low B lymphocyte subsets as defined in Methods section
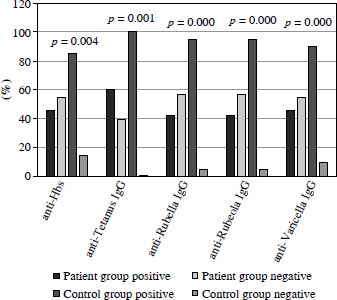
All of the specific antibody titers against vaccine antigens (hepatitis B, tetanus, rubella, rubeola, varicella) were examined, and the percentages of negative or inadequate results were significantly high in the patient group (Fig. 2). In addition, antibodies against pneumococcus pneumonia in the patient group (35.88 ±19.20 mg/l) were significantly lower than in the control group (47.70 ±18.92 g/l) (p = 0.032).
Fig. 2
Comparison of specific antibody titers against vaccine antigens between patient and control groups
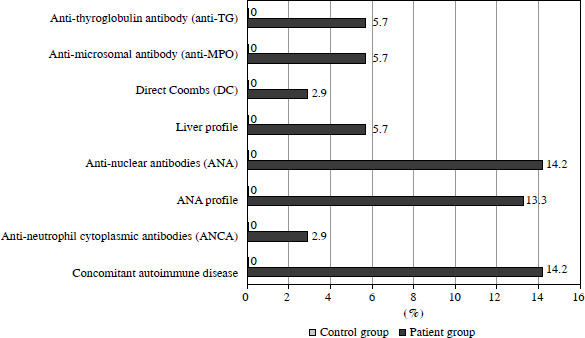
Autoantibodies were positive in different percentages, between 2.9% and 14.3%, in the patient group, although they were all negative in the control group. Juvenile idiopathic arthritis, type 1 diabetes, autoimmune hemolytic anemia and autoimmune thyroiditis were the observed autoimmune diseases in our patient group (Fig. 3).
Percentages of total T-cells (CD3+), T helper cells (CD3+CD4+) and T cytotoxic cells (CD3+CD8+) were significantly lower in the patient group when compared with healthy controls. As an important part of natural immunity, both percentages and absolute numbers of natural killer cells (NK) (CD3–CD16+CD56+) were significantly elevated in DGS patients (p = 0.010 and 0.014, respectively). In contrast, NKT cells (CD3+CD16+CD56+), known to be strongly associated with autoimmunity, were significantly decreased (p = 0.001 and 0.002) in the same study group (Table 2).
Table 2
Comparison of lymphocyte subsets, NK cells, and NKT cells between patient and control groups
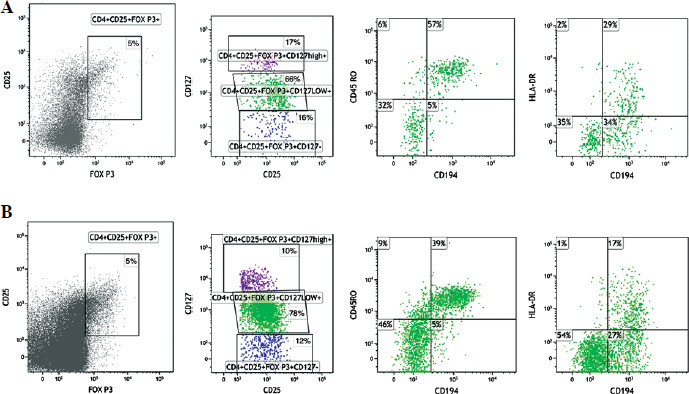
Absolute numbers of total Tregs (CD3+CD4+CD25+FOXP3+CD127lowCD194+), memory Tregs (CD3+CD4+CD25+FOXP3+CD127lowCD45RO+CD194+) and active Tregs (CD3+CD4+CD25+FOXP3+CD127lowHLADR+CD194+) were significantly decreased in the patient group (p = 0.036, 0.006, and 0.008, respectively) (Table 3). Treg cell flow cytometric images of a patient and a control are shown in Figure 4.
Table 3
Comparison of Treg cells (CD3+CD4+CD25+Foxp3+CD127lowCD194+ (CCR4)) between patient and control groups
Fig. 4
Flow cytometry characteristics of total regulatory T cells (CD3+CD4+CD25+Foxp3+CD127lowCD194+), memory Treg cells (CD3+CD4+CD25+Foxp3+CD127lowCD45RO+CD194+), naive Treg cells (CD3+CD4+CD25+Foxp3+CD127low-CD45RO–CD194+) and active Treg cells (CD3+CD4+CD25+Foxp3+CD127lowHLADR+CD194+) in the peripheral blood of a DiGeorge syndrome patient (A) and a healthy control (B)
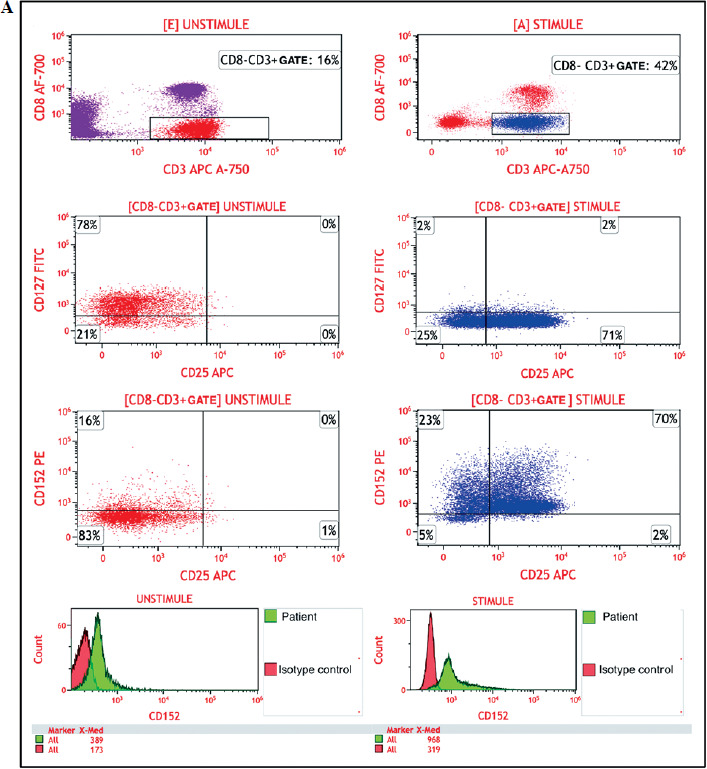
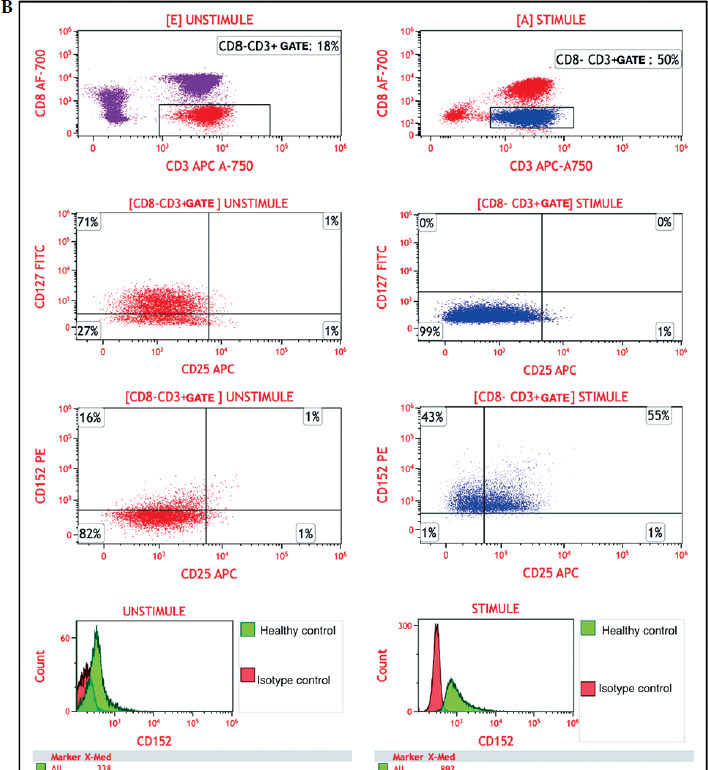
We also compared CTLA-4 expressing active T helper, T cytotoxic, and Treg cells, and CD28 expressing active T helper and T cytotoxic cells between the patient and control groups. The differences in percentages, absolute counts, and mean fluorescence intensities between basal and post-activation values for CTLA-4+ and CD28+ were not statistically significant when compared between the patient and control groups (p > 0.05) (data not shown). The flow cytometric gating strategy image of one patient and one control, and the histogram image of the patient/control and isotype control, are presented in Figure 5.
Fas+ active T cytotoxic cells (CD3+CD8+HLA-DR+CD95+) and Fas+ naive T helper cells (CD3+CD4+-CD45RA+CD95+) were significantly higher in DGS patients compared to the control group (Table 4). FasL in different T-cell subsets did not show any significant difference between the two groups, and as expected, FasL could not be detected on the surface of most T-cell subsets (Table 4).
Table 4
Comparison of Fas and FasL expressing naive, memory and active T cytotoxic and T helper cells between patient and control groups
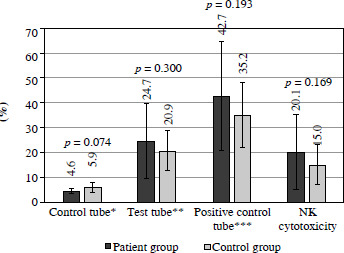
NK cell-specific cytotoxicity was higher in the patient group (20.1 ±15.4) compared to healthy controls (15.0 ±7.8), but this difference was not statistically significant (p > 0.05) (Fig. 6).
Fig. 6
Comparison of NK cytotoxicity rate between patient and control groups. Dead cell rate (%) in: * Negative control tube containing only target cells without effectors, **Test tube (1 : 25) containing both target cells and effectors, ***Positive control tube (1 : 25 + IL-2) containing target cells, effectors and IL-2
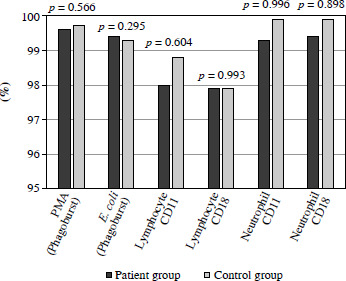
Comparisons of phagocytic activity (PMA, E. coli) and adhesion molecules (CD11a, CD18) on lymphocytes and neutrophils between the patient and control groups were performed, and as shown in Figure 7, no significant difference was found in any of the evaluated parameters. Additionally, MFI values were compared. While the mean CD11a expression in lymphocytes in the patient group was 650 ±289, it was 396 ±152 in the control group, and it was significantly higher in the patient group (p = 0.001). In contrast, the mean CD11a expression in neutrophils in the patient group was 112 ±30, while it was 131 ±26 in the control group, and it was significantly higher in the control group (p = 0.021). The mean CD18 expression in the patient group was 42 ±20 in lymphocytes and 24 ±11 in neutrophils, while it was 35 ±12 in lymphocytes and 25 ±10 in neutrophils in the control group, and there was no significant difference between the groups (p > 0.005).
Discussion
In the present study, we investigated serum immunoglobulins, specific antibody responses against vaccine antigens, B-cell subsets, autoantibodies, T-cell subsets, NK cells, NKT cells, total Tregs and Treg subsets, CTLA-4, CD28, Fas and FasL expressing cells, NK-cell specific cytotoxicity, phagocytic activity of macrophages, and CD11a and CD18 expressing lymphocytes and neutrophils of patients with DGS compared to healthy individuals. Some of these parameters have not been investigated before. We identified several novel and important findings that may contribute to understanding the pathophysiology of DGS and provide insights into the types and underlying mechanisms of some severe infections and predisposition to autoimmunity.
In our previous study, 15.1% of DGS patients had low IgG, 30.3% had low IgM, and 21.2% had low IgA levels, whereas IgG, IgM, and IgA levels were all normal in 68.0% [12]. In McLean-Tooke et al.’s study [13], there were minor immunoglobulin deficiencies in 15 of 26 patients. In another multicenter study by Patel et al. [14] with 1023 DGS patients, in patients older than three years, 19% had IgG levels lower than 500 mg/dl. In the same study, analysis of low IgG levels and CD3+ T-cell count showed no clear association [14]. In this study, similar to the above studies, 20% of IgG, 22.9% of IgM and 5.7% of IgA values were found to be below 2SD of the normal range (Fig. 1B). We did not find any clear association between low CD3 counts and abnormal IgG, IgA, or IgM levels (data not shown).
Yu et al. [3] reported a lack of hepatitis B vaccine antibodies in 46.2% of DGS patients. In Finocchi et al.’s study [15], 38% of patients had impaired production of specific antibodies. In our study, a lack of specific IgG antibodies against hepatitis B, tetanus, rubella, rubeola, and varicella was found to be significantly high in the patient group (Fig. 2). In addition, antibodies against pneumococcal polysaccharide antigens were quantitatively examined, and they were significantly low in the patient group (p = 0.032).
McLean-Tooke et al. [13] reported that DGS patients showed a significantly decreased proportion of memory B-cells in the B-cell pool seen in both nonclass-switched and class-switched cells. However, total B-cell numbers were unaffected. Finocchi et al. [15] also found a similar decrease in total memory B-cells, especially for CD19+- CD27+IgD+IgM+ cells. In 855 DGS patients from the US Immunodeficiency Network (USIDNET) and the European Society for Immunodeficiencies (ESID), although B-cell counts were mostly normal, non-switched memory B-cells were reported to be significantly decreased, whereas class-switched memory B-cells were only slightly reduced [6]. In the present study, compared with DGS patients and healthy controls, total memory B-cells, non-switched memory B-cells, and switched memory B-cells were significantly low in DGS cases (Table 1A). In addition, similar to recent studies, 57.2% of patients had low levels of non-switched memory B-cells, and 22.8% had low values of switched memory B-cells (Table 1B).
B-cell subsets other than memory B-cells have not been investigated before. In our study, immature transitional B-cells, immature B-cells, plasmablasts and active B-cells were significantly high in the patient group (Table 1A). This increase seems to be due to a counterreaction to the decrease of memory B-cells. The alterations in B-cell subsets might be one of the defects contributing to impaired humoral immunity.
Deshpande et al. [2] reported that among 415 DGS patients, autoimmunity was observed in 17 (4.1%) and patients with autoimmunity had significantly low IgG. In the same study, patients with absolute CD3 levels below 50% of age-related normal values had higher levels of autoimmunity [2]. Mustillo et al. [6] reported that the overall incidence of autoimmune disease in DGS was 10%. In the present study, anti-nuclear antibody positivity among DGS patients was the highest (14.2%). Four different types of autoimmune diseases were observed in 5 cases (14.2%) (Fig. 3).
Tolerance against self-antigens is regulated by a variety of cells including NKT cells [16]. Although predisposition to autoimmunity in DGS patients has been reported for a long time, NKT cells have not been investigated yet. In the present study, NKT cells of DGS cases were significantly decreased in percentages and absolute counts compared to healthy children (p < 0.001 and p < 0.002, respectively) (Table 2). This finding suggested that NKT cells may play a role in the development of autoimmunity in DGS patients. The importance of NKT cells in DGS was highlighted by this observation, but this hypothesis needs to be investigated in a multi-center study with a large number of DGS patients with a higher prevalence of autoimmune disease.
It is well established that Tregs play a protective role in autoimmune disease [17, 18]. In 2008, McLean-Tooke et al. [13] reported a significant decrease in Treg cells with a strong correlation between Tregs and recent thymic emigrants (RTE) from the thymus, suggesting an association between them. Mustillo et al. [6] also reported a decrease in Treg production. In this study, similar to the above studies, absolute numbers of total Tregs, memory Tregs and active Tregs were significantly decreased in the patient group (Table 3). Lower numbers of Treg cells in DGS patients suggest that the generation and maintenance of these cells in children is related to thymic dysfunction and seems to have a role in predisposing to autoimmunity.
Tregs express Foxp3 and high levels of CTLA-4. The critical role of CTLA-4 and CD28 in T-cell activation and autoimmune diseases has been previously reported [19]. However, CTLA-4 and CD28 expressing T-cells in the peripheral blood of DGS patients have not been investigated before. CTLA-4 expressing active CD4+ and CD8+ cells and Treg cells and CD28 expressing active CD4+ and CD8+ cells were examined. However, no significant difference for CTLA-4+ and CD28+ cells was found when comparing the study and control groups.
Apoptosis plays a significant role in the development and pathogenesis of autoimmune diseases [20]. In 2019, Aresvik et al. [5] observed increased Fas expression on lymphocytes from DGS patients, while there was no difference in serum levels of FasL. In the same study, no increased spontaneous apoptosis was observed, but upon activation, anti-Fas induced apoptosis was significantly elevated in DGS patients compared to healthy controls [5]. In a DGS case report by Gupta et al. [21], Fas and FasL expression, both at protein and mRNA levels, were elevated, whereas Bcl-2 expression was decreased at both levels. In this study, we measured CD95 and CD95L expression in different T-cell populations from DGS patients, using flow cytometry. Similar to the above limited studies, Fas+ active T cytotoxic cells and Fas+ naive T helper cells were found to be significantly elevated in DGS patients. We did not measure FasL in serum or cell culture supernatants by the ELISA technique, and, as it was expected, FasL could not be detected on the surface of naive, memory, active T cytotoxic, and T helper cells (Table 4).
To date, the role of NK cells in DGS patients remains unclear. Sirianni et al. [22] observed a decrease in mature thymocytes in children with DGS, while NK-cell numbers were normal. Mclean-Tooke et al. [13] also did not find any significant difference in NK-cell counts between DGS patients and controls. In the present study, NK-cell counts were higher in the patient group (21.3%, 554/mm3) compared to healthy children (15.1%, 361/mm3) (Table 2), suggesting that this is a relative increase due to low T-cell counts.
Macrophages and neutrophil leukocytes are specialized for a highly efficient mode of phagocytosis [23]. Although DGS is a T- and B-cell disorder, we also evaluated phagocytic activity against PMA and E. coli, and no alteration was found (Fig. 7). CD11a and CD18 are molecules of the integrin family and innate immunity, and they also have a signaling role in the early events of T-cell activation [24]. These adhesion molecules – also referred to as accessory molecules of CD11a/CD18 on lymphocytes and neutrophils – were examined in peripheral blood of DGS patients in the present study. However, there was no difference between the patient and control groups (Fig. 7).
In conclusion, these findings support the recommendation for patients with 22q11.2del to have periodic evaluations with a humoral immune assessment beginning after one year of age, and patients also require testing for autoimmunity. IgG antibodies against vaccine antigens, including pneumococcal polysaccharide antigens, should be detected to exclude impaired specific antibody responses. Although T-cell lymphopenia may improve with age, these patients require lifelong monitoring and follow-up for phenotypic and laboratory manifestations of immune dysregulation.