Introduction
Laryngeal squamous cell carcinoma (LSCC) is a common tumor of the head and neck, and its incidence and mortality continue to increase annually [1, 2]. Pathological factors of LSCC include excessive drinking and smoking [3]. Nowadays, surgery is the primary treatment for LSCC, supplemented by chemotherapy [4]. Although clinical outcomes for LSCC have been improved to some extent, the LSCC prognosis is still not optimistic. Consequently, searching for effective tumor markers is a central focus of LSCC research.
Due to the tissue and cell specificity of circular RNAs (circRNAs), they exert pivotal roles in various physiological and pathological processes [5, 6]. Abundant evidence indicates that circRNAs have important functions in carcinogenesis, including cell proliferation and invasion [7, 8]. Currently, increasing circRNAs are associated with LSCC. For instance, circ_CORO1C is highly expressed in LSCC, and circ_CORO1C knockdown slows down LSCC progression by modulating miR-654-3p/USP7 [9]; hsa_circ_0036722 is lessened in LSCC and markedly associated with LSCC differentiation, implying that hsa_circ_0036722 acts as a potential diagnostic marker for LSCC [10]. Crucially, microarray analysis in previous research indicated that circRNAs (n = 302) are elevated in LSCC, and circRNAs (n = 396) are decreased [11]. Nevertheless, circRNA biological functions in LSCC have not been fully revealed. CircRNA High Mobility Group AT-hook 2 (circHMGA2, also named hsa_circ_0027446) is a newly identified circRNA and exhibits a cancer-promoting function. For example, circHMGA2 advances lung adenocarcinoma metastasis in both in vitro and in vivo models [12]; circHMGA2 is overexpressed in non-small cell lung cancer, and a high circHMGA2 level is associated with a poor prognosis in non-small cell lung cancer [13]. Until now, circHMGA2 function in LSCC remains unknown.
In this research, we identified a novel circRNA circHMGA2 in LSCC, which was elevated in LSCC, and high circHMGA2 expression was associated with TNM stage of LSCC patients. Thus, our studies further aimed to elucidate the biological function circHMGA2 in LSCC and its latent mechanism, in an attempt to provide a novel promising target for LSCC intervention.
Material and methods
Patient tissues
This prospective study included patients (n = 66) diagnosed with LSCC at our hospital between September 2022 and June 2023. All fresh tissues were stored at –80°C. The protocol was approved by the Institutional Ethical Review Committee of our hospital. Inclusion criteria: 1) All patients provided written informed consent; 2) All patients were diagnosed with LSCC for the first time; 3) None of the patients received chemotherapy or radiotherapy before the operation. Exclusion criteria: 1) LSCC patients with other diseases; 2) patients who have received chemotherapy or radiotherapy. Associations between circHMGA2 and LSCC patients’ pathological characteristics (n = 66) are shown in Table 1.
Table 1
Correlation between circHMGA2 expression and clinicopathological features of LSCC patients
Cell culture and co-culture assay
LSCC cells (TU686 and AMC-HN-8) were from ATCC (Manassas, USA). Human bronchial epithelioid cells (NP69) were supplied by Procell (Wuhan, China). All cells were placed in DMEM (Procell) with 10% FBS (Procell) and maintained at 37°C and 5% CO2.
THP-1 cells were from ATCC and were placed in RPMI-1640 (Procell) with 10% FBS. THP-1 cells were exposed to 40 nM PMA (MedChemExpress, USA) to obtain M0 macrophages. Then, cells were exposed to 20 ng/ml interleukin (IL)-4 and 20 ng/ml IL-13 to obtain M2 macrophages [14]. Different groups of LSCC cell supernatant were co-cultured with M2 macrophages induced by IL-4/IL-13 to investigate the effects of different groups of LSCC on M2 macrophage polarization [15].
Cell transfection
Sh-circHMGA2#1, sh-circHMGA2#2, sh-circHMGA2#3, and pcDNA3.1-ROCK1 were obtained from GenePharma (Shanghai, China). MiR-384 mimic and miR-384 inhibitor were from RiboBio (Guangzhou, China). LSCC cell transfection was conducted with Lipofectamine 2000 (Procell) [16].
Quantitative real-time polymerase chain reaction
Total RNA extraction was conducted with TRIzol (Thermo Fisher Scientific). The cDNA was synthesized using a Reverse Transcription Kit (Thermo Fisher Scientific) or miRNA cDNA Synthesis Kit (Thermo Fisher Scientific). Real-time PCR was conducted on a 7500 Real-Time PCR System (Applied Biosystems, USA) with SYBR Green I (Yeasen, Shanghai, China). Thermal cycles were: 95°C for 1 min, followed by 40 cycles at 95°C for 15 s, 60°C for 30 s, and 72°C for 30 s. U6 and GAPDH were the internal references. Gene levels were measured using 2–ΔΔCt. Primer sequences are presented in Table 2.
Table 2
Primer sequences
Cell Counting Kit-8 assay
LSCC cells (1 × 10³) were plated in 96-well plates and cultured for one day. Then Cell Counting Kit-8 (CCK-8) reagent (10 µl, Meilunbio, Dalian, China) was added and further cultured for 2 h. Eventually, absorbance at 450 nm was measured with a microplate reader (Thermo Fisher Scientific).
Cell invasion analysis
LSCC cell invasion was conducted using Transwell inserts coated with Matrigel (MBL, Beijing, China). LSCC cells (2 × 10⁴) were added to the upper chamber of transwell inserts (8.0 µm, MBL). Medium with 20% FBS (Procell) was added to the lower chambers as a chemoattractant. Serum-free cell suspension was added to the upper chambers. Forty-eight hours later, non-invasive cells were removed and cells on the lower side were fixed using 4% paraformaldehyde (Thermo Fisher Scientific). Then cells were stained with 0.05% crystal violet (Shyuanye, Shanghai, China), and several invasive cells were counted with a microscope (Thermo Fisher Scientific).
Enzyme-linked immunosorbent assay
After LSCC cell supernatant was co-cultured with IL-4/IL-13-induced THP-1 cells, IL-10 and transforming growth factor β (TGF-β) levels in THP-1 cells were quantified using IL-10 enzyme-linked immunosorbent assay (ELISA) kits (Abcam) and TGF-β ELISA kits (YSRIBIO, Shanghai, China), following the reagent manufacturer’s standard procedure.
Western blot
After proteins were extracted, protein contents were quantified using the BCA Protein Assay Kit (Beyotime, Shanghai, China). Proteins were dissociated with SDS-PAGE (GenScript, Nanjing, China) and were further transferred onto PVDF membranes (Shhk, Shanghai, China). After membranes were blocked, membranes were incubated with antibodies against IL-4 (1 : 1000, ab62351), CCL22 (MDC, 1 : 3000, ab124768), ARG1 (1 : 1000, ab315110), iNOS (1 : 1000, ab178945), TNF-α (1 : 1000, ab183218), TLR4 (1 : 1000, ab13556), ROCK1 (1 : 500, ab134181), and β-actin (ab8226) at 4°C. Later, membranes were exposed to secondary antibodies (1 : 2000, ab205718) for one hour. All antibodies were supplied by Abcam (Cambridge, UK). Protein bands were visualized using enhanced chemiluminescence (ECL; Thermo Fisher Scientific).
Database analysis
Putative binding sites of circHMGA2 and miR-384 were predicted using Circinteractome (https://circinteractome.nia.nih.gov/index.html). Also, the presence of miR-384 binding sites in the 3′ untranslated region of ROCK1 was predicted by StarBase (http://starbase.sysu.edu.cn/).
Dual-luciferase reporter assay
CircHMGA2-wild type (WT), circHMGA2-mutant (MUT), ROCK1-WT, and ROCK1-MUT were synthesized by RiboBio (Guangzhou, China). CircHMGA2-WT, circHMGA2-MUT, ROCK1-WT, and ROCK1-MUT were cloned into pGL3-promoter (Promega, USA). Luciferase reporter plasmids and miR-384 mimic were transfected into LSCC cells with Lipofectamine 2000 as per the supplier’s instructions. Relative luciferase activity was tested by the Dual-Luciferase Reporter Assay System (Promega).
RNA pull-down
A biotin-labeled circHMGA2 probe (Sangon, Shanghai, China) and a bio-NC probe (Sangon) were applied for RNA pull-down assay. After the LSCC cell lysate was obtained, it was further incubated with a bio-circHMGA2 probe at 4°C. One night later, the RNA complex that was bound to beads was eluted, the mixture was exposed to TRIzol for RNA extraction, and miR-384 expression was tested.
Tumor xenograft experiments
BALB/C nude mice (6-8 weeks) were supplied by Gempharmatech (Nanjing, China). This research was approved by the Ethics Committee of the Second Affiliated Hospital of Nanchang University and was conducted given ARRIVE guidelines (https://arriveguidelines.org).
For the instruction of xenograft tumor models, AMC-HN-8 cells transfected with sh-circHMGA2 (1 × 10⁷ cells) were subcutaneously inoculated into nude mice [17]. Six mice were assigned to each group. Subcutaneous tumor size was tested every 7 days between 7 and 28 days. Tumor volume was quantified according to the following formula: V (volume) = (length × width2)/2. After five weeks, all mice were sacrificed.
Hematoxylin-eosin staining and immunohistochemistry assays
LSCC tissues were fixed in 4% paraformaldehyde, embedded in paraffin, and cut into 5-µm sections. Subsequently, sections were exposed to hematoxylin and eosin (Solarbio, Beijing, China).
LSCC tissues were fixed with 4% paraformaldehyde, embedded in paraffin, and cut into 5-µm sections. Then the sections were exposed to antibodies against Ki-67 (1 : 200, ab16667), CD206 (Mannose Receptor, Abcam, 0.1 µg/ml), and CD163 (Abcam, 1 : 500) at 4°C. Next, sections were washed and exposed to secondary antibodies (Abcam) at room temperature. Then sections were stained using DAB (Solarbio) and further counterstained with hematoxylin (Solarbio).
Statistical analysis
All data were presented as mean ±SD. Student’s t-test or one-way ANOVA test followed by Tukey’s post hoc test was applied to compare two or multiple groups. Survival curves were determined using Kaplan-Meier analysis. The relationship between circHMGA2 expression and LSCC clinicopathological characteristics was assessed by the chi-square test. P < 0.05 was considered to indicate statistical significance.
Results
High expression of circHMGA2 in LSCC
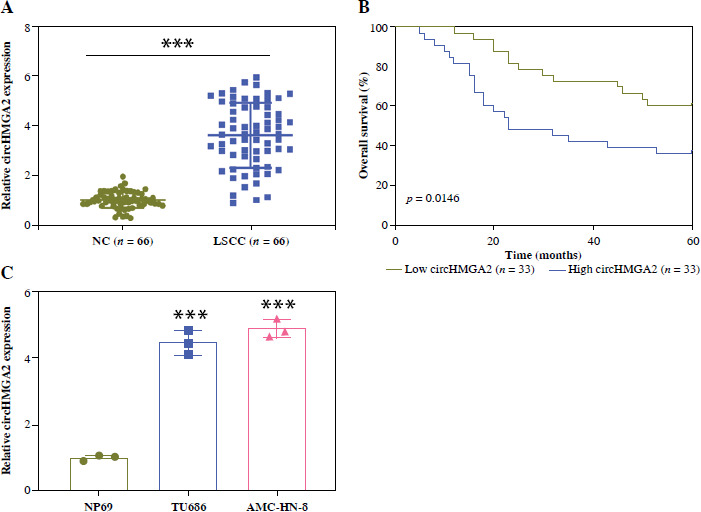
To investigate the role of circHMGA2 in mediating LSCC, we evaluated circHMGA2 expression in LSCC and found that circHMGA2 was overexpressed in LSCC tissues (Fig. 1A). Kaplan-Meier survival curve analysis further confirmed that overall survival of patients with elevated circHMGA2 levels was shorter (Fig. 1B). Meanwhile, elevated circHMGA2 expression was associated with TNM stage, but not with LSCC patients’ age, gender, tumor size, or lymphatic metastasis (Table 1). Also, circHMGA2 levels in LSCC cells (TU686 and AMC-HN-8 cells) were more than four times higher than those in NP69 cells (Fig. 1C). Overall, circHMGA2 was raised in LSCC.
Fig. 1
Validation of circHMGA2 expression in LSCC tissues and cells. A) Analysis of circHMGA2 expression in LSCC tissues and adjacent tissues (n = 66) using quantitative real-time polymerase chain reaction (qRT-PCR). B) Median value of circHMGA2 expression in LSCC (n = 66) was set as a cut-off value. The association between circHMGA2 and the overall survival rate of LSCC was examined via Kaplan-Meier analysis. C) Detection of circHMGA2 expression in LSCC cells (TU686 and AMCHN- 8 cells) and human bronchial epithelioid cells (NP69) using qRT-PCR. ***p < 0.001 vs. NC, NP69 cells. NC – negative control
CircHMGA2 knockdown suppresses LSCC proliferation and invasion and inhibits M2 macrophage polarization
The biological function of circHMGA2 in LSCC cells was further examined. First, circHMGA2 was knocked down in LSCC cells, and transfection efficiency verification revealed that sh-circHMGA2#1, #2, and #3 effectively reduced circHMGA2 levels in LSCC cells (Fig. 2A). sh-circHMGA2#1 (named sh-circHMGA2) showed the highest knockdown efficiency and was applied in our research. CCK-8 further demonstrated that silencing circHMGA2 reduced LSCC cell proliferation (Fig. 2B).
Fig. 2
CircHMGA2 mediates LSCC cell proliferation and invasion and regulates M2 macrophage polarization. A) Sh-circHMGA2#1, #2, or #3 was transfected into LSCC cells for 48 h. Detection of circHMGA2 expression using qRT-PCR. B) Sh-circHMGA2#1 (sh-circHMGA2) was transfected into LSCC cells for 48 h. LSCC cell proliferation was determined by Cell Counting Kit-8 (CCK-8). C) LSCC cell invasion was estimated via Transwell (scale bar: 100 μM). *p < 0.05, **p < 0.01 vs. sh-NC
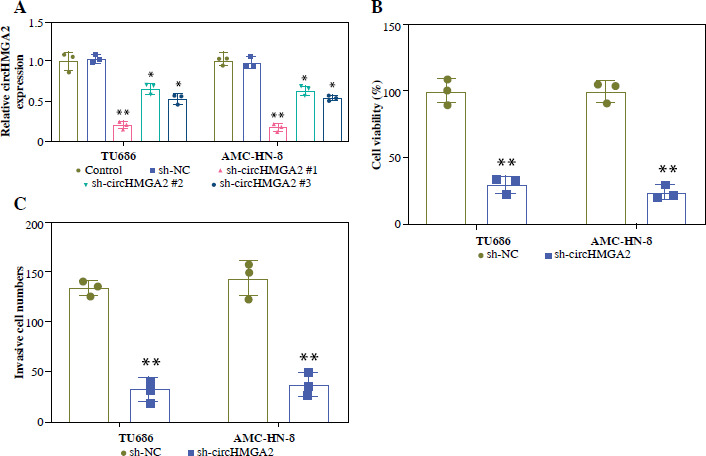
Fig. 2. Cont.
D) LSCC cell invasion was estimated via Transwell (scale bar: 100 μM). E) THP-1 cells were treated with 40 nM PMA to obtain M0 macrophages; the cells were then exposed to 20 ng/ml IL-4 and 20 ng/ml IL-13 to obtain M2 macrophages. LSCC cell supernatant was further co-cultured with M2 macrophages induced by IL-4/IL-13. CD206 and CD163 expression levels were determined with qRT-PCR. F) Comparison of M2 representative cytokines IL-10 and TGF-β concentrations by enzyme-linked immunosorbent assay (ELISA). *p < 0.05, **p < 0.01 vs. sh-NC
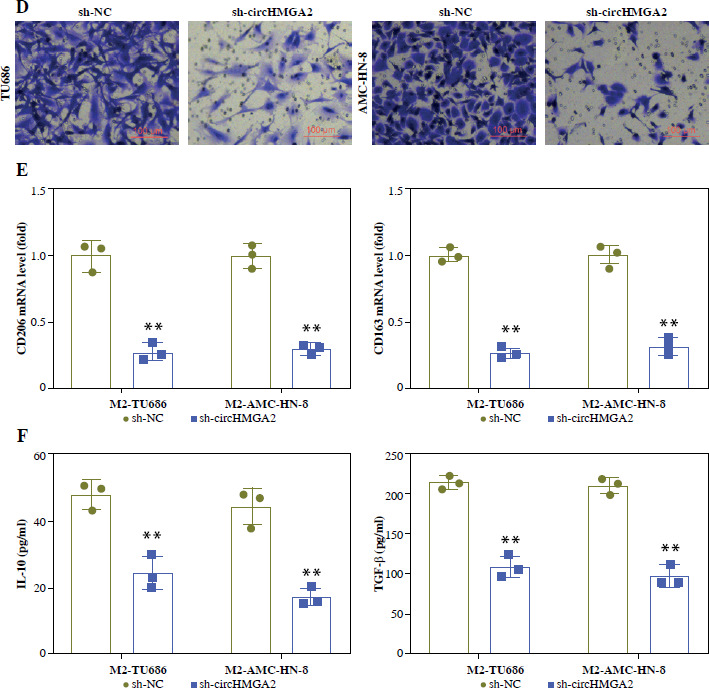
Fig. 2. Cont.
G, H) Analysis of protein levels of M2 macrophage markers (IL-4, CCL22, and ARG1) and M1 macrophage markers (iNOS, TNF-α, and TLR4) using Western blot. *p < 0.05, **p < 0.01 vs. sh-NC
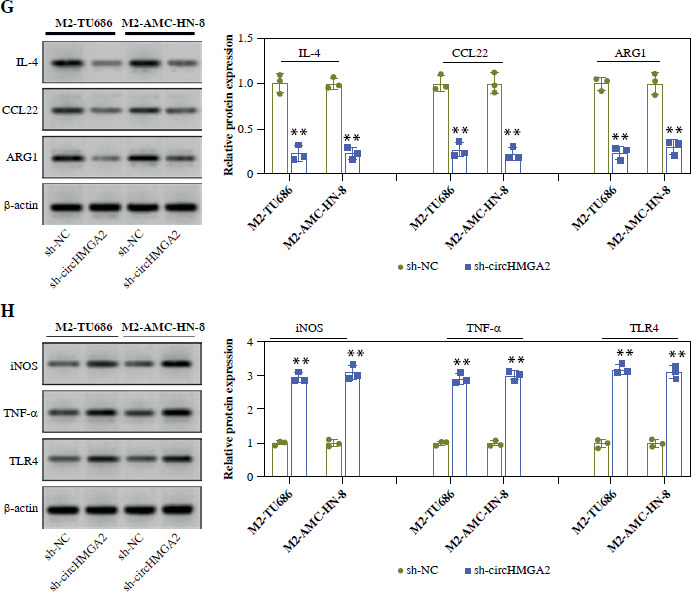
Additionally, circHMGA2 knockdown attenuated LSCC cell invasion ability (Fig. 2C, D). After LSCC cell supernatant was co-cultured with IL-4/IL-13-induced THP-1 cells, we further confirmed that circHMGA2 knockdown reduced levels of M2 macrophage marker molecules CD206 and CD163 in cells (Fig. 2E), and reduced M2 representative cytokines IL-10 and TGF-β contents (Fig. 2F). Meanwhile, circHMGA2 knockdown reduced the protein levels of M2 macrophage markers IL-4, CCL22, and ARG1 (Fig. 2G) and increased the protein levels of M1 macrophage markers iNOS, TNF-α, and TLR4 (Fig. 2H). These findings implied that circHMGA2 knockdown inhibited LSCC cell proliferation and invasion, and repressed M2 macrophage polarization.
CircHMGA2 targets miR-384
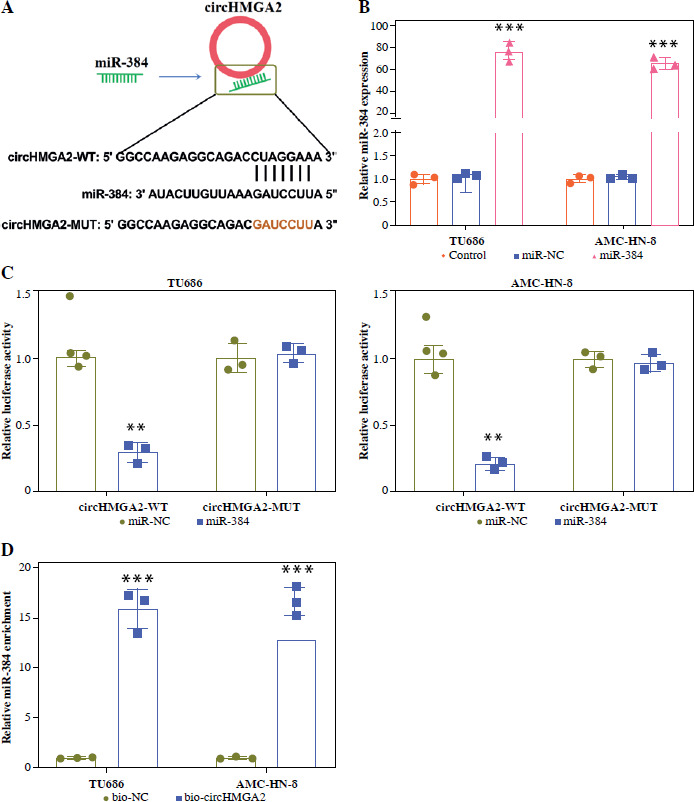
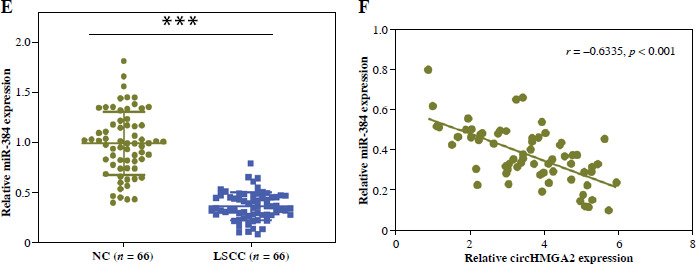
As shown in Figure 3A, circHMGA2 contains miR-384 binding sites. MiR-384 expression was confirmed to markedly rise after transfecting miR-384 mimic into TU686 and AMC-HN-8 cells (Fig. 3B). On this basis, we further found that luciferase activity was lessened in circHMGA2-WT by nearly 75% in response to miR-384 overexpression, and luciferase activity showed no significant changes in circHMGA2-MUT (Fig. 3C). Also, the bio-circHMGA2 probe enriched more miR-384 in comparison with the NC probe (Fig. 3D). Meanwhile, miR-384 expression was decreased in LSCC tissues (Fig. 3E), and miR-384 was negatively correlated with circHMGA2 expression in LSCC tissues (Fig. 3F). Hence, miR-384 was the downstream target of circHMGA2.
Fig. 3
MiR-384 was verified as a candidate target miRNA of circHMGA2. A) Putative binding sites of circHMGA2 and miR-384. B) MiR-384 mimic was transfected into LSCC cells for 48 h. Comparison of miR-384 expression via qRT-PCR. C) Luciferase activity was determined using a dual-luciferase reporter assay. D) The relation between circHMGA2 and miR-384 was validated with RNA pulldown. **p < 0.01 vs. miR-NC. ***p < 0.001 vs. miR-NC, NC, and bio-NC
MiR-384 modulates ROCK1 expression
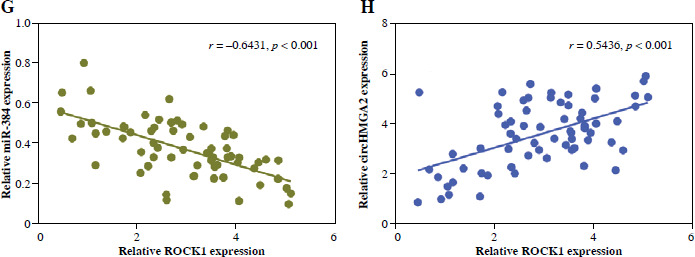
Subsequently, downstream regulatory molecules of miR-384 were further investigated. As shown in Figure 4A, miR-384 binding sites are located in the 3′ untranslated region of ROCK1. Also, miR-384 mimic reduced luciferase activity in LSCC cells, and this reduction disappeared after mutation of the predicted binding sites (Fig. 4B). Additionally, miR-384 overexpression reduced ROCK1 protein level in LSCC cells (Fig. 4C). Then, miR-384 inhibitor was verified to transfect into LSCC cells (Fig. 4D). Based on these findings, we further corroborated that sh-circHMGA2 decreased ROCK1 protein level, and co-transfection with miR-384 inhibitor abolished this decrease (Fig. 4E). Also, ROCK1 expression was higher in LSCC than that in adjacent tissues (Fig. 4F). We additionally observed that miR-384 was negatively associated with ROCK1 expression in LSCC (r = –0.6431, p < 0.001, Fig. 4G), while circHMGA2 was positively associated with ROCK1 expression (r = 0.5436, p < 0.001, Fig. 4H). Collectively, these results show that miR-384 negatively regulated ROCK1 expression in LSCC.
Fig. 4
MiR-384 mediates ROCK1 expression. A) StarBase predicted the presence of miR-384 binding sites in the 3′ untranslated region of ROCK1. B) Analysis of luciferase activity in LSCC cells by dual-luciferase reporter assay. **p < 0.01 vs. miR-NC, NC inhibitor, and sh-NC; ***p < 0.001 vs. NC; ##p < 0.01 vs. sh-circHMGA2
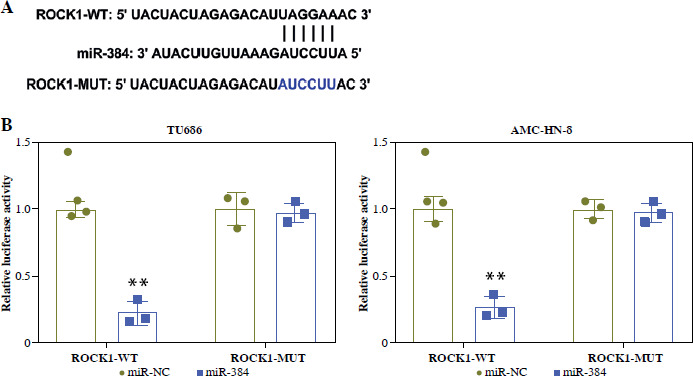
Fig. 4. Cont.
C) MiR-384 mimic was transfected into LSCC cells for 48 h. ROCK1 protein level was tested using Western blot. D) MiR-384 inhibitor was transfected into LSCC cells for 48 h. Detection of miR-384 expression via qRT-PCR. E) Sh-circHMGA2 and/or miR-384 inhibitor was transfected into LSCC cells for 48 h. ROCK1 protein level was measured with Western blot. F) Comparison of ROCK1 expression in LSCC tissues and adjacent tissues (n = 66) by qRT-PCR. **p < 0.01 vs. miR-NC, NC inhibitor, and sh-NC; ***p < 0.001 vs. NC; ##p < 0.01 vs. sh-circHMGA2
CircHMGA2 mediates LSCC progression through miR-384/ROCK1
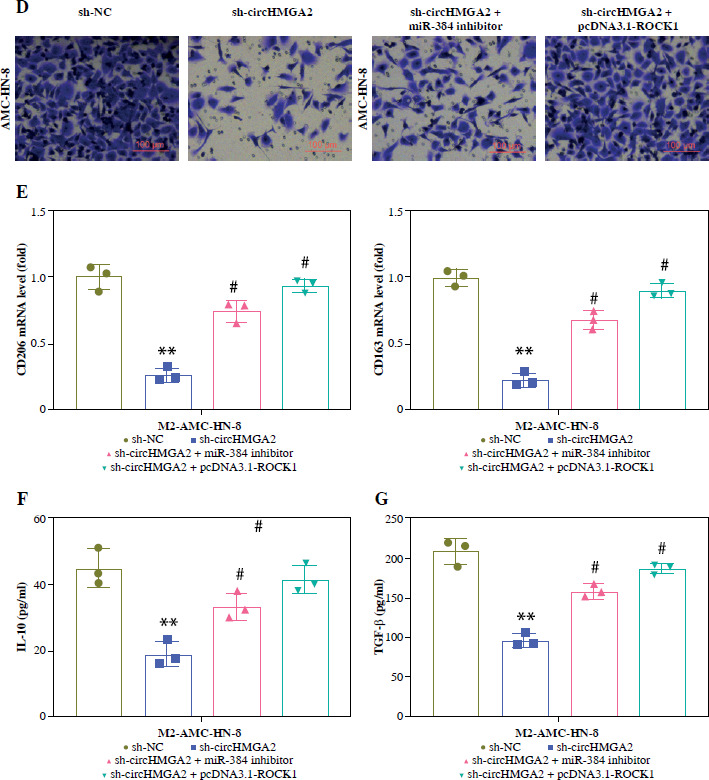
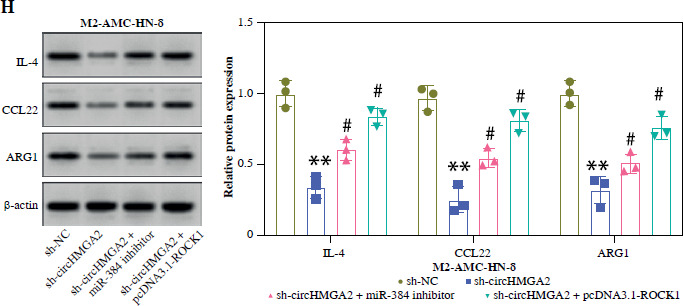
We further examined whether circHMGA2 modulated the LSCC process via miR-384/ROCK1. After ROCK1 was successfully overexpressed in LSCC (Fig. 5A), CCK-8 further demonstrated that circHMGA2 knockdown attenuated LSCC cell proliferation ability by nearly 75%, while co-transfection of miR-384 inhibitor or pcDNA3.1-ROCK1 abolished this trend (Fig. 5B). LSCC cell invasion analysis displayed a similar trend (Fig. 5C, D). Additionally, circHMGA2 knockdown reduced CD206 and CD163 levels in THP 1 cells, and this decrease was abolished after transfecting miR-384 inhibitor or pcDNA3.1-ROCK1 (Fig. 5E). Moreover, circHMGA2 knockdown reduced IL-10 and TGF-β expression, while transfecting miR-384 inhibitor or pcDNA3.1-ROCK1 abolished these trends (Fig. 5F, G). Silencing of circHMGA2 decreased the protein levels of M2 macrophage markers IL-4, CCL22, and ARG1, but miR-384 inhibitor or pcDNA3.1-ROCK1 abolished this decrease (Fig. 5H). The above findings suggest that circHMGA2 promotes the malignant phenotype of LSCC via the miR-384/ROCK1 axis.
Fig. 5
CircHMGA2 regulates LSCC progression through miR-384/ROCK1. A) pcDNA3.1-ROCK1 was transfected into LSCC cells (AMC-HN-8) for 48 h. Detection of ROCK1 protein level using Western blot. B) After sh-circHMGA2 was transfected into LSCC cells (AMCHN- 8) for 48 h, miR-384 inhibitor or pcDNA3.1-ROCK1 was transfected into LSCC cells (AMC-HN-8) for 48 h. Analysis of LSCC cell proliferation by CCK-8. C) LSCC cell invasion was assessed using Transwell (scale bar: 100 μM). **p < 0.01 vs. vector, sh-NC; #p < 0.05 vs. sh-circHMGA2
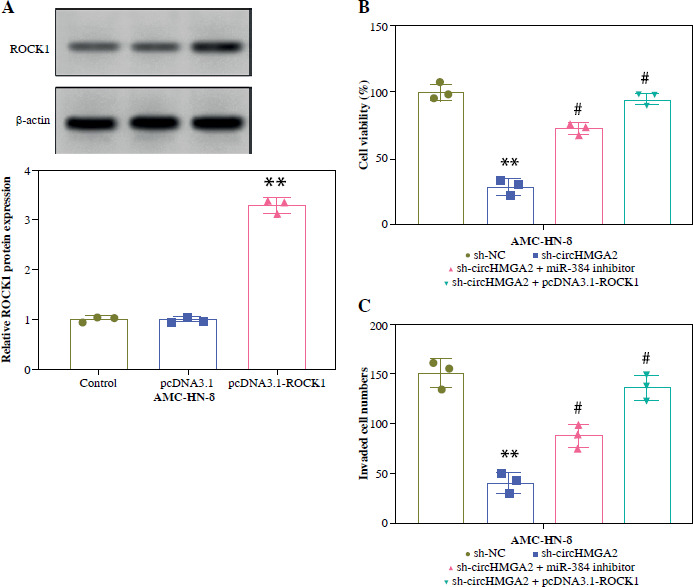
Fig. 5. Cont.
D) LSCC cell invasion was assessed using Transwell (scale bar: 100 μM). E) After exposing THP-1 cells to 40 nM PMA to obtain M0 macrophages, the cells were treated with 20 ng/ml IL-4 and 20 ng/ml IL-13 to obtain M2 macrophages. LSCC cell supernatant was then co-cultured with M2 macrophages induced by IL-4/IL-13. Comparison of CD206 and CD163 expression by qRT-PCR. F, G) IL-10 and TGF-β concentrations were tested using ELISA. **p < 0.01 vs. vector, sh-NC; #p < 0.05 vs. sh-circHMGA2
Interference with circHMGA2 reduces LSCC proliferation and suppresses M2 polarization in vivo
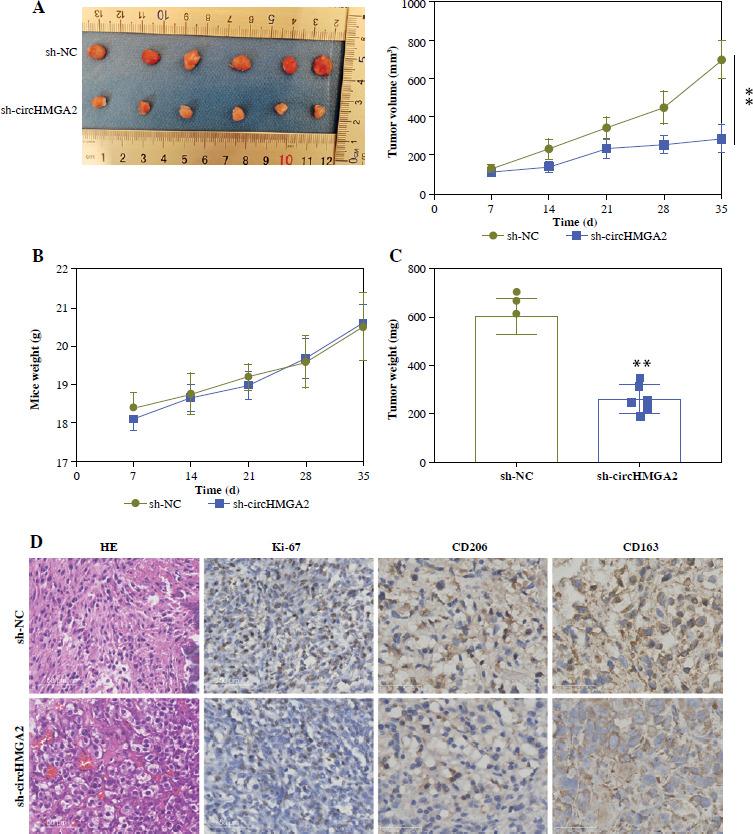
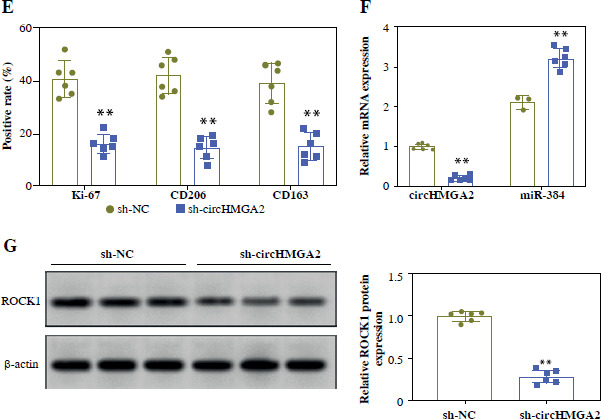
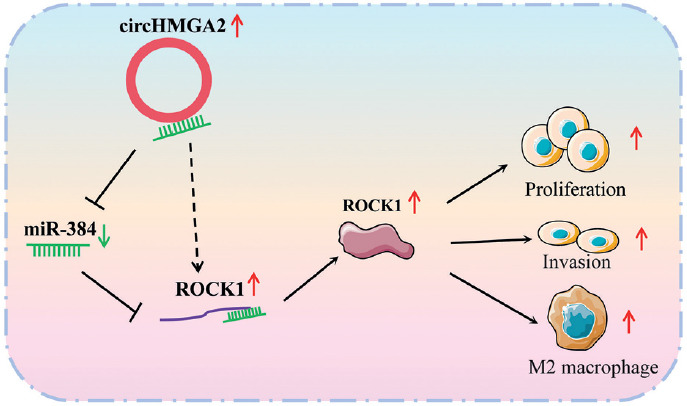
To further inquire whether circHMGA2 modulated LSCC growth in vivo, AMC-HN-8 cells transfected with sh-circHMGA2 were subcutaneously inoculated into nude mice. As shown in Figure 6A, sh-circHMGA2 resulted in reduced subcutaneous tumorigenesis in nude mice. Also, circHMGA2 knockdown did not markedly change the weight of mice (Fig. 6B), but markedly reduced tumor weight (Fig. 6C). HE staining further revealed that circ-HMGA2 knockdown reduced the number of lesions (Fig. 6D). Also, the positive staining rates of Ki-67, CD206, and CD163 in LSCC tissues were decreased after knocking down circHMGA2 (Fig. 6D, E). Meanwhile, circHMGA2 knockdown reduced circHMGA2 expression, and elevated miR-384 expression in LSCC tissues (Fig. 6F), while lowering ROCK1 protein levels in LSCC tissues (Fig. 6G). To sum up, our experimental data indicate that circ-HMGA2 promotes the malignant biological phenotype and M2 macrophage polarization via the miR-384/ROCK1 axis in LSCC (Fig. 7). In general, sh-circHMGA2 inhibited LSCC growth and reduced M2 polarization in vivo.
Fig. 6
CircHMGA2 mediates LSCC proliferation and M2 polarization in vivo. AMC-HN-8 cells transfected with sh-circHMGA2 (1 × 10⁷ cells) were subcutaneously inoculated into nude mice. A) Analysis of mouse tumor volume. B) Measurement of weight of mice. C) Comparison of mouse tumor weight. **p < 0.01 vs. sh-NC. D) Number of lesions was determined using hematoxylin-eosin (HE) staining (scale bar: 50 μM).
Discussion
Laryngeal squamous cell carcinoma is a highly aggressive malignancy [18], and there is an urgent need to understand the mechanisms involved in LSCC. In the past few decades, the specific biological functions of circRNAs in cancer have attracted various concerns [19, 20]. Nevertheless, circRNA functions in LSCC have not been fully revealed. Here, we discovered that a novel circRNA, circHMGA2, was higher in LSCC tissues than in adjacent tissues, and elevated circHMGA2 expression was associated with the TNM stage of LSCC patients, and patients with high circHMGA2 had shorter overall survival. Similar to this finding, circHMGA2 can be applied as a therapeutic target for lung adenocarcinoma [12]. Also, functional data suggested that circHMGA2 knockdown repressed LSCC proliferation and invasion, and circHMGA2 knockdown reduced M2 macrophage polarization. Mechanistic data further demonstrated that circHMGA2 modulated LSCC malignant phenotype via miR-384/ROCK1. All these findings strongly suggest that circHMGA2 is a novel circRNA that exerts oncogenic activity in LSCC.
Considering the significance of circRNAs in LSCC research [21, 22], this study sought to identify more circRNAs that function in LSCC. In the current research, circHMGA2 was raised in LSCC. Also, circHMGA2 knockdown weakened LSCC proliferation and invasion. Previous studies have demonstrated that M2 macrophages are macrophage phenotypes, and accelerate tumor cell growth and carcinogenesis in a tumor microenvironment [23, 24]. As has been reported, M2 macrophages express CD163 and CD206 [25]. Our study showed that circ-HMGA2 knockdown reduced CD163 and CD206 expression in LSCC cells. IL-4, CCL22, and ARG1 are M2 macrophage markers, and iNOS, TNF-α, and TLR4 are M1 macrophage markers [26, 27]. This research further indicated that silencing circHMGA2 reduced protein levels of the M2 macrophage markers IL-4, CCL22, and ARG1, while increasing protein levels of the M1 macrophage markers iNOS, TNF-α, and TLR4, suggesting that circHMGA2 knockdown inhibited M2 macrophage polarization.
Subsequently, we elucidated the mechanism by which circHMGA2 functions in LSCC. Numerous studies indicate that circRNAs block the inhibitory function of target genes by absorbing microRNAs (miRNAs) [28, 29]. Abnormal expression of miRNAs is associated with LSCC progression. For instance, array analysis demonstrated that miR-31 and let-7a are overexpressed in LSCC, and they are applied to diagnose LSCC patients with high sensitivity and specificity [30]; miR-196b is raised in LSCC, and miR-196b expression is associated with histological grade and TNM stage of LSCC patients [31]. Critically, circRNAs act as sponges for miRNAs, sequestering them and thereby restraining their functions. For instance, Wei et al. demonstrated that hsa_circ_0042666 modulates LSCC cell growth via competitively binding to miR-223, and provides a novel LSCC therapeutic strategy [32]; also, Yin et al. reported that circZNF609 knockdown weakens LSCC cell proliferation and invasion via absorbing miR-134-5 [33]. Meanwhile, miR-384 is modulated by multiple circRNAs in different human diseases [34, 35]. Here, we preliminarily confirmed that miR-384 was the downstream target of circHMGA2, and miR-384 showed low expression in LSCC. Furthermore, our experimental data indicated that miR-384 was negatively associated with circ-HMGA2 expression in LSCC tissues. These data suggest that circHMGA2 has oncogenic function in LSCC through sponging miR-384.
To further define a latent mechanism for miR-384, miR-384 targets were predicted. We preliminarily determined that ROCK1 was an LSCC target through StarBase and dual-luciferase reporter assay. Previously, miR-384 was reported to modulate tumor development via mediating target genes [36, 37]. The Rho-associated coiled-coil containing kinase 1 (ROCK1) gene is located on 18q11.1, and protein serine/threonine kinase encoded by the ROCK1 gene is activated after binding to the GTP-bound form of Rho [38]. ROCK1 has been reported to be involved in the pathogenesis of metabolism-related diseases, including hypertension, Alzheimer’s disease, and diabetes [39, 40]. Previous studies have shown that ROCK1 has pivotal functions in LSCC. For example, high ROCK1 expression is positively correlated with LSCC tumor size and lymph node metastasis [40]. ROCK1 mediates epithelial-mesenchymal transition to promote LSCC metastasis via the JAK2/STAT3/ERK1/2 axis, and targeting ROCK1 might provide a potential therapeutic strategy for LSCC [41]. Crucially, ROCK1 is reported to be regulated by miRNAs, including miR-136-5p [42] and miR-195 [43]. Similarly, we observed that ROCK1 was raised in LSCC, miR-384 was negatively associated with ROCK1 in LSCC, and circHMGA2 was positively associated with ROCK1 expression. Furthermore, circHMGA2 modulated LSCC malignant phenotype via miR-384/ROCK1. Meanwhile, circHMGA2 knockdown reduced LSCC growth and inhibited M2 polarization in vivo.
Overall, this research explored the circHMGA2 function in LSCC and provided evidence that circHMGA2 acts as a novel oncogene in LSCC through the miR-384/ROCK1 axis, implying that circHMGA2 is an LSCC biomarker. However, this research had some limitations, as follows: (I) Only loss of function analysis was performed; (II) circ-HMGA2 might modulate LSCC through other mechanisms, which requires further investigation. We intend to perform further research to build upon these findings.