
Introduction
The symptoms of rheumatoid arthritis (RA), a persistent systemic inflammatory disease, include bone loss, joint degeneration, synovial cell growth, and persistent inflammation of the synovial membrane [1]. The frequency of RA is between 0.5% and 1% worldwide, significantly impacting patients’ quality of life by causing joint dysfunction, disability, and an increased risk of cardiovascular diseases and other comorbidities [2, 3]. Although the exact etiology of RA remains incompletely understood, genetic factors, environmental influences, and immune system dysregulation play crucial roles in its pathogenesis [4]. Abnormal activation of the immune system leads to excessive proliferation and invasion of synovial fibroblasts, exacerbating joint damage [5]. Macrophages, as key immune cells, are crucial to the pathophysiology of RA. They promote inflammation and tissue destruction in the synovium by secreting various inflammatory and chemotactic factors [6]. Additionally, macrophages modulate the function and behavior of synovial fibroblasts through the regulation of oxidative stress and signaling pathways such as the nuclear factor erythroid 2-related factor 2 (NRF2) pathway [7]. Therefore, investigating the regulatory mechanisms of macrophages in RA is of paramount importance to elucidate its pathogenesis and develop novel therapeutic strategies.
Selenium-binding protein 1 (SELENBP1) is a highly conserved protein that covalently binds selenium (Se). It plays critical roles in multiple physiological functions, including protein degradation, cell differentiation, cellular motility and redox modulation, etc. [8, 9]. Specifically, SELENBP1 regulates cellular selenium levels by binding to selenium, influencing the activity of selenium-related enzymes, and participating in antioxidant stress and cellular protection against oxidative damage [10]. Moreover, SELENBP1 is involved in protein degradation pathways, such as the ubiquitin-proteasome system, by regulating protein degradation to maintain protein homeostasis within cells [11]. The biological functions of SELENBP1 include regulating cell metabolism, protein degradation, oxidative stress responses, and cell cycle control [12]. Recent studies have made significant progress in understanding SELENBP1 in cancer research. For instance, decreased SELENBP1 expression in colorectal cancer is associated with tumor invasiveness and malignancy [13]; low SELENBP1 expression in breast cancer correlates with poor prognosis [14]; and downregulation of SELENBP1 in hepatocellular carcinoma is closely related to cancer cell proliferation and metastasis [15]. These findings underscore the significant regulatory roles of SELENBP1 in different types of cancer, potentially serving as diagnostic biomarkers and therapeutic targets. However, the clinical importance and biological functions of SELENBP1 in RA have not been thoroughly investigated.
This study focused on macrophage upregulation of SELENBP1 to block NRF2 signaling activation, promoting reactive oxygen species (ROS) production, and enhancing synovial fibroblast proliferation and migration. By elucidating the role of SELENBP1 in RA, this research offers a fresh viewpoint and possible therapy options for the management of RA.
Material and methods
Bioinformatics analysis
Data on gene expression profiles were taken from the GEO database (https://www.ncbi.nlm.nih.gov/). GSE141529 includes 8 RA patients and 8 healthy peripheral blood samples. We analyzed the expression of SELENBP1 in GSE141529.
Cell culture
Human macrophage cell line THP-1 (TIB-202) was purchased from American Type Culture Collection (Manassas, VA, USA). Human rheumatoid arthritis synovial fibroblasts (MH7A) were purchased from AnWei-sci (HUM-AWP-s010RA, Shanghai, China). All cells underwent short tandem repeat (STR) analysis and mycoplasma testing. The cells were cultivated at 37oC in a humidified atmosphere with 5% CO2 in Dulbecco’s Modified Eagle Medium (DMEM; C0891-500ml, Beyotime, Shanghai, China). The DMEM was supplemented with 10% heat-inactivated fetal bovine serum (C0251, Beyotime, Shanghai, China) and antibiotics (10 U/ml penicillin and 100 µg/ml streptomycin).
Induction of M1 macrophage polarization
The M1 phenotype of macrophages was achieved by incubation with lipopolysaccharide (LPS, 1 µg/ml; ST1470-10 mg, Beyotime, Shanghai, China) and IFN-γ (20 ng/ml; P5664-100 µg, Beyotime, Shanghai, China) in culture medium for 6 hours [16].
Transient transfection with SELENBP1 short hairpin RNA and cell treatment
Transient transfection of short hairpin RNA (shRNA) oligonucleotides targeting SELENBP1 (shSELENBP1, 5´-CACTTATATGTATGGGACT-3´; GeneCopoeia, Guangzhou, China) and a negative control (shNC, 5´-TTCTCCGAACGTGTCACGT-3´; GeneCopoeia, Guangzhou, China) was performed using Lipofectamine 2000 reagent (11668019, Invitrogen, CA, USA). THP-1 cells were cultured to 30-40% confluency and divided into control, LPS/IFN-γ, LPS/IFN-γ-shNC, LPS/IFN-γ- shSELENBP1 and LPS/IFN-γ-shSELENBP1+ML385 groups. LPS/IFN-γ-shNC, LPS/IFN-γ-shSELENBP1 and LPS/IFN-γ-shSELENBP1+ML385 groups were transfected with corresponding shRNA oligonucleotides (20 pmol). The cultures were grown for 48 hours after transfection. THP-1 cells in the LPS/IFN-γ-shSELENBP1 + ML385 group were treated with a specific inhibitor of NRF2 (ML385; 5 µM, treated for 0.5 hours) (846557-71-9, MCE, NJ, US) [17]. Then, LPS/IFN-γ, LPS/IFN-γ-shNC, LPS/IFN-γ-shSELENBP1 and LPS/IFN-γ-shSELENBP1 + ML385 groups were treated with LPS/IFN-γ as described above for subsequent investigations.
Real-time quantitative polymerase chain reaction
Using β-actin as a control, real-time quantitative polymerase chain reaction (RT-qPCR) was used to assess the expression of SELENBP1 and NRF2. The UNIQ-10 column Total RNA Purification Kit (B511143, Sangon Biotech, Shanghai, China) was used to obtain total RNA. RNA (2 µg) was reverse-transcribed using HiScript II Q RT SuperMix for qPCR (+gDNA wiper) (R222-01, Vazyme, Nanjing, China). cDNA was amplified using ChamQ Universal SYBR qPCR Master Mix (Q711-02/03, Vazyme, Nanjing, China). RT-qPCR was conducted on a CFX96 Real-Time PCR Detection System (Bio-Rad, Harkles, CA) under the following conditions: 95oC for 15 seconds, 60oC for 20 seconds, and 72oC for 10 seconds, for a total of 40 cycles. Threshold cycle (Ct) values were determined for each sample. Relative expression of messenger RNA (mRNA) was calculated using the 2–∆∆Ct method. Sangon Biotech (Shanghai, China) created the following primers that were used to amplify cDNA: 5´-CAGCGCTTCTACAAGAACGA-3´ (F), 5´-TGATCAGGCCTGGCATTT-3´ (R) for SELENBP1; 5´-ATGACCCAAGCCGAGAAGG´-3´ (F), 5´-CGGCCAAGTCTTAGAGTTGTTG-3´ (R) for β-actin.
ROS detection
Macrophages were cultured in 96-well plates (10000 cells/well). Using 2´,7´-dichlorofluorescin diacetate (DCFH-DA) (Cat. No. S0033S; Beyotime, Shanghai, China) in accordance with the manufacturer’s instructions, intracellular ROS was identified. DCFH-DA was diluted 1000× in PBS. The cells were treated with 100 µl of the working solution and incubated for 20 minutes (37oC). Following incubation, PBS was used to wash the cells three times for five minutes each time, and ROS intensity was observed under a fluorescence microscope (Olympus BX60, Center Valley, PA) at 200× magnification (488 nm for excitation and 525 nm for emission).
Analysis of oxidative stress levels
Analysis was performed using THP-1 cells. The supplier’s directions were followed for the extraction of cell lysates. The Jiangsu Jiancheng Bioengineering Institute (Nanjing, China) provided the assay kits (A001-3-2, A003-1-2, and A006-1-1) to measure the concentrations of superoxide dismutase (SOD, A001-3-2), malondialdehyde (MDA, A003-1-2), and reduced glutathione (GSH, A006-1-1). Using a spectrophotometer (Immilen, CA, US), the absorbance of SOD, MDA, and GSH was measured at 450 nm, 532 nm and 420 nm, respectively.
Cell co-culture
As described above, THP-1 cells from control, LPS/IFN-γ, LPS/IFN-γ-shNC, LPS/IFN-γ-shSELENBP1, and LPS/IFN-γ-shSELENBP1 + ML385 groups were cultured in DMEM supplemented with 10% FBS. For the purposes of the subsequent investigations, pre-cultured MH7A cells were then plated in 6-well plates and co-cultured with the previously treated THP-1 cells for 48 hours [18].
Nuclear/cytosolic fractionation
Nuclear and cytosolic proteins of MH7A cells co-cultured with THP-1 cells were separated using the Cell Nuclear/Cytosol Fractionation Kit (P0028, Beyotime, Shanghai, China) in line with the manufacturer’s guidelines. Finally, supernatants containing nuclear and cytosolic proteins were collected for Western blot analysis.
Western blotting
Protein extraction was carried out using Cell Signaling Technology, Inc.’s RIPA buffer, which contains 1% Triton X-100, 150 mmol/l NaCl, 1 mmol/l EGTA, 50 mmol/l Tris-HCl, 0.1% SDS, 1% sodium deoxycholate and PMSF. The BCA assay kit (Sigma-Aldrich, Merck) was used to measure the amount of protein. Ten percent SDS-PAGE was used to separate the total proteins (30 µg/sample). After that, the separated proteins were placed on nitrocellulose membranes (EMD Millipore) and allowed to stand at room temperature for an hour before being blocked with 5% non-fat milk. Membranes were subsequently incubated with the following primary antibodies: anti-NRF2 (68 kDa; ab62352; Abcam, Cambridge, UK), anti-Histone H3 (15 kDa; ab1220; Abcam, Cambridge, UK), and anti-β-actin (42 kDa; ab6276; Abcam, Cambridge, UK). After primary antibody incubation, membranes were incubated with HRP-conjugated Goat Anti-Rabbit IgG secondary antibody (ab150077; Abcam, Cambridge, UK) or Goat Anti- Mouse IgG secondary antibody (ab150113; Abcam, Cambridge, UK). Using a gel imaging system (Bio-Rad Laboratories, Inc.), protein bands were visualized using the ECL reagent (KF8003, Affinity Biosciences, CA, US), and the Image Pro Plus 6.0 software (Media Cybernetics, Inc., CA, USA) was used for analysis. The cytosolic internal control was β-actin, while the nuclear internal control was histone H3.
3-(4,5-dimethyl-2-thiazolyl)-2,5-diphenyl-2-H- tetrazolium bromide (MTT) assay for cell proliferation
After the MH7A cells in each group were treated as mentioned above, each well received 20 µl of MTT reagent (ST316, Beyotime, Shanghai, China), followed by replacement of 100 µl of fresh culture medium. After the cells had been cultured for a further four hours, the culture medium was removed and disposed of, and 150 µl of dimethyl sulfoxide (DMSO) was added to dissolve the formazan crystals. A microplate reader (BIO-RAD, CA, US) served to measure the optical density (OD) at 490 nm for every well on the plate.
Transwell assay
MH7A cells were suspended in DMEM at 1 × 10⁵ cells/ml, and 200 µl of the MH7A cell suspension was introduced to the upper chamber of Transwell plates (FTW001-6Ins, Beyotime, Shanghai, China). Pre-cultured MH7A cells were placed in the lower chamber along with macrophages and co-cultured for 48 hours in DMEM supplemented with 10% FBS. Following a 48-hour incubation period at 37°C, cells were fixed for 20 minutes using 4% paraformaldehyde (P0099-100 ml, Beyotime, Shanghai, China) and stained for 15 minutes using 0.1% crystal violet (C0121-100 ml, Beyotime, Shanghai, China). The amount of cells in five freely chosen fields (250×) was observed using an inverted microscope (Olympus, Center Valley, PA).
Statistical analysis
To conduct statistical studies, GraphPad Prism 8.0 was used. The data are displayed as mean ± standard deviation. Independent sample t-tests were used for mRNA analysis of SELENBP1 in THP-1 cells after LPS/IFN-γ treatment, while one-way ANOVA was employed for group comparisons, followed by Tukey’s post hoc test. P-values of less than 0.05 were deemed statistically significant.
Results
SELENBP1 is highly expressed in RA and LPS/IFN-γ-induced macrophages
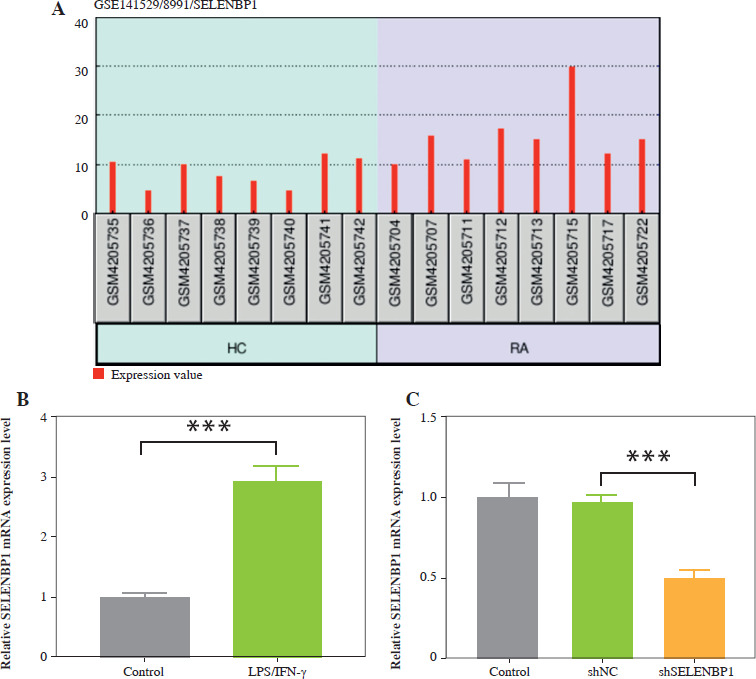
Bioinformatics analysis of the GSE141529 gene expression profile revealed upregulation of SELENBP1 in RA (Fig. 1A). Subsequently, we detected the expression of SELENBP1 in THP-1 cells stimulated with LPS/IFN-γ, and found that SELENBP1 expression was significantly upregulated (p < 0.001, Fig. 1B). We constructed a SELENBP1 knockdown model in LPS/IFN-γ-stimulated THP-1 cells using shSELENBP1 transfection, which was validated to have high knockdown efficiency by RT-qPCR (p < 0.001, Fig. 1C).
Fig. 1
SELENBP1 is highly expressed in rheumatoid arthritis and LPS/IFN-γ-induced macrophages. A) Gene expression profile of selenium-binding protein 1 (SELENBP1) was analyzed by bioinformatics methods in GSE141529. B) Level of SELENBP1 in THP-1 cells stimulated with LPS/IFN-γ was detected by real-time quantitative polymerase chain reaction (RT-qPCR). C) Level of SELENBP1 in THP-1 cells transfected with shSELENBP1 was detected by RT-qPCR. Each experiment was repeated three times. ***p < 0.001
SELENBP1 knockdown reduced the ROS production and oxidative stress in THP-1 cells induced by LPS/IFN-γ
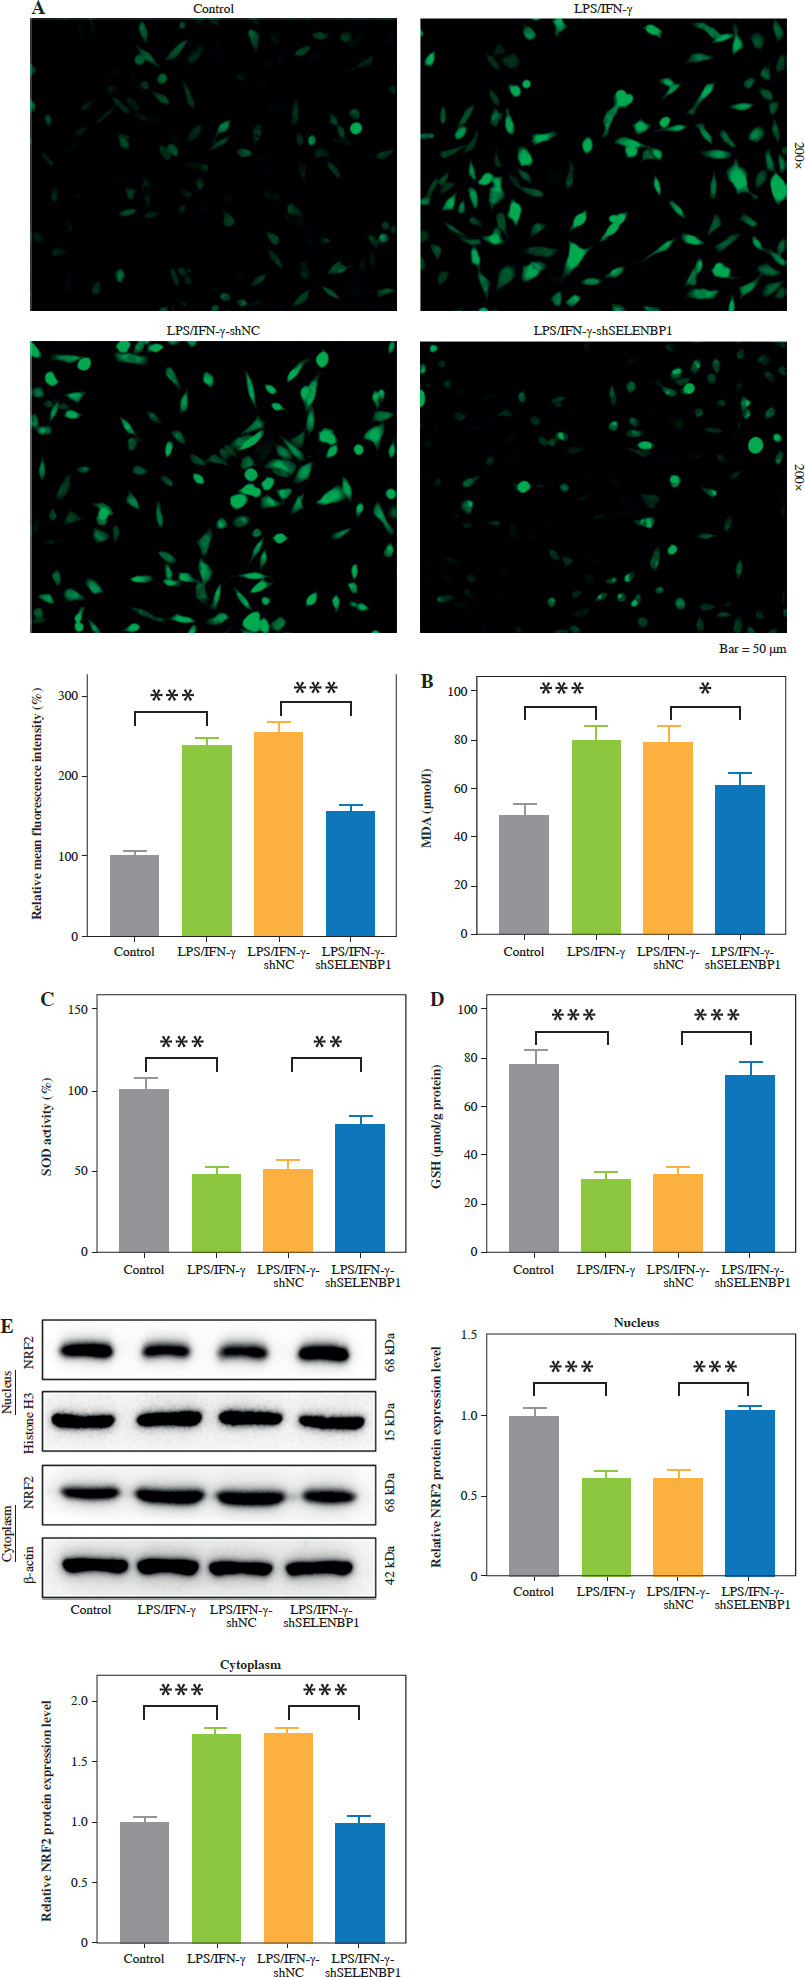
To verify SELENBP1’s impact on ROS generation, intracellular ROS levels were analyzed using DCFH-DA staining. LPS/IFN-γ treatment increased ROS levels in THP-1 cells (p < 0.001, Fig. 2A). Knockdown of SELENBP1 significantly attenuated the increase in ROS levels induced by LPS/IFN-γ (p < 0.001, Fig. 2A). LPS/IFN-γ treatment increased MDA levels in THP-1 cells and inhibited SOD activity and GSH levels (p < 0.001, Fig. 2B-D). SELENBP1 knockdown reversed the impacts induced by LPS/IFN-γ (p < 0.05, Fig. 2B-D).
Fig. 2
Analysis of ROS production, oxidative stress and NRF2 expression in THP-1 cells. A) ROS levels in THP-1 cells of control, LPS/IFN-γ, LPS/IFN-γ-shNC, and LPS/IFN-γ-shSELENBP1 groups were detected by 2′,7′-dichlorodihydrofluorescein diacetate (DCFH-DA) assay. Magnification 200×, scale bar 50 μm. B) Levels of malondialdehyde (MDA) in THP-1 cells of control, LPS/IFN-γ, LPS/IFN-γ-shNC, and LPS/IFN-γ-shSELENBP1 groups were detected by assay kits C, D) Levels of superoxide dismutase (SOD), and glutathione (GSH) in THP-1 cells of control, LPS/IFN-γ, LPS/IFN-γ-shNC, and LPS/IFN-γ- shSELENBP1 groups were detected by assay kits. E) NRF2 protein levels in nuclear and cytoplasmic fractions of THP-1 cells in control, LPS/IFN-γ, LPS/IFN-γ- shNC, and LPS/IFN-γ-shSELENBP1 groups were detected by Western blot. Histone H3 was used as a nuclear loading control, and β-actin as a cytoplasmic loading control. Each experiment was repeated three times. *p < 0.05, **p < 0.01, ***p < 0.001
SELENBP1 knockdown reversed the decrease of nuclear NRF2 and increase cytoplasmic NRF2 levels in THP-1 cells induced by LPS/IFN-γ
The cytoplasmic and nuclear NRF2 expression levels were assessed. LPS/IFN-γ induction decreased nuclear NRF2 levels but increased cytoplasmic NRF2 levels in THP-1 cells (p < 0.001, Fig. 2E). Knockdown of SELENBP1 increased nuclear NRF2 levels, while inhibiting cytoplasmic NRF2 levels in LPS/IFN-g induced THP-1 cells (p < 0.001, Fig. 2E).
SELENBP1 knockdown reversed the promoting effects of LPS/IFN-γ treated THP-1 cells on proliferation and migration of MH7A cells in a co-culture model
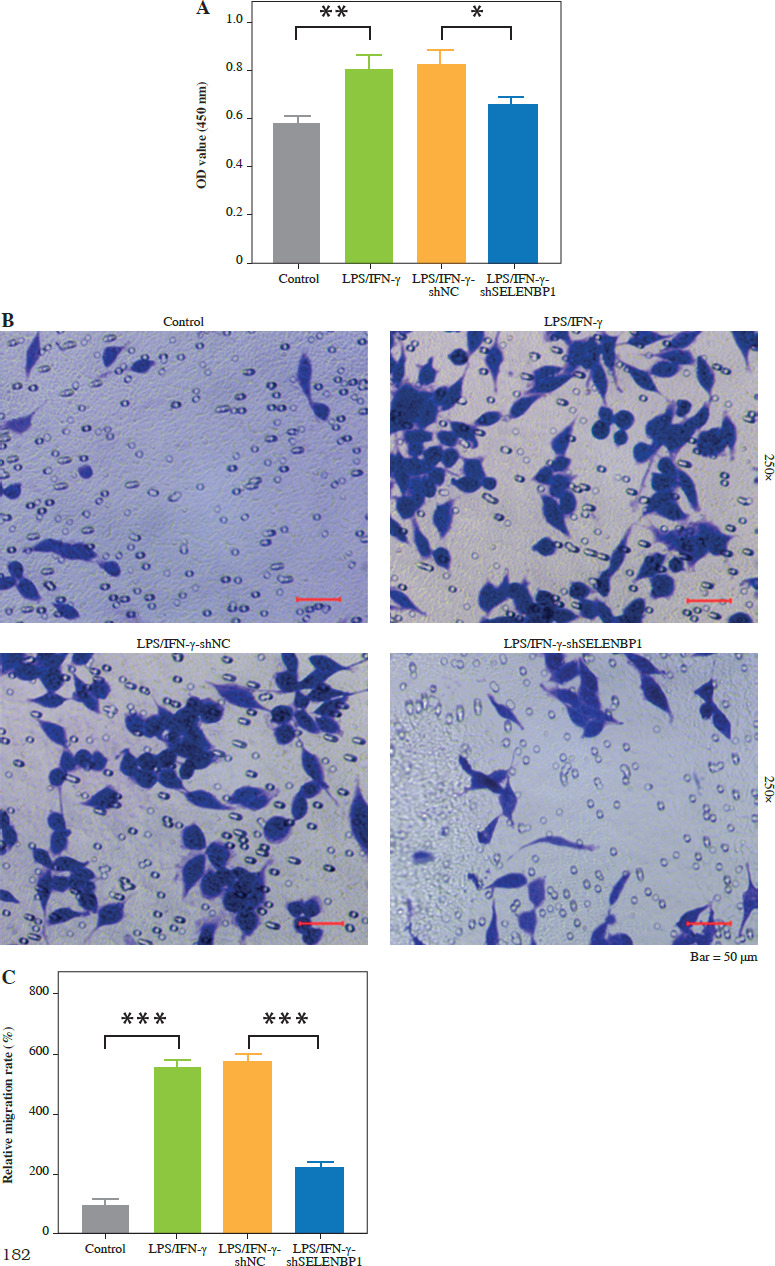
After 48 hours of co-culture of THP-1 and MH7A cells, LPS/IFN-γ induced an increase in MH7A cell proliferation (p < 0.01, Fig. 3A) and migration (p < 0.001, Fig. 3B, C). SELENBP1 knockdown reversed the effects induced by LPS/IFN-γ (p < 0.05, Fig. 3A-C).
Fig. 3
SELENBP1 silencing inhibits proliferation and migration of synovial fibroblasts. A) Proliferation of MH7A cells co-cultured with THP-1 cells of control, LPS/IFN-γ, LPS/IFN-γ-shNC, and LPS/IFN-γ-shSELENBP1 groups was detected by 3-(4,5-dimethyl-2-thiazolyl)-2,5-diphenyl-2-H-tetrazolium bromide (MTT) assay. B, C) Migration of MH7A cells co-cultured with THP-1 cells of control, LPS/IFN-γ, LPS/IFN-γ-shNC, and LPS/IFN-γ-shSELENBP1 groups was detected by transwell assay. Magnification 250×, scale bar 50 μm. Each experiment was repeated three times. *p < 0.05, **p < 0.01, ***p < 0.001
SELENBP1 knockdown reduced macrophage ROS production and inhibited synovial fibroblast proliferation and migration by activating NRF2 signaling
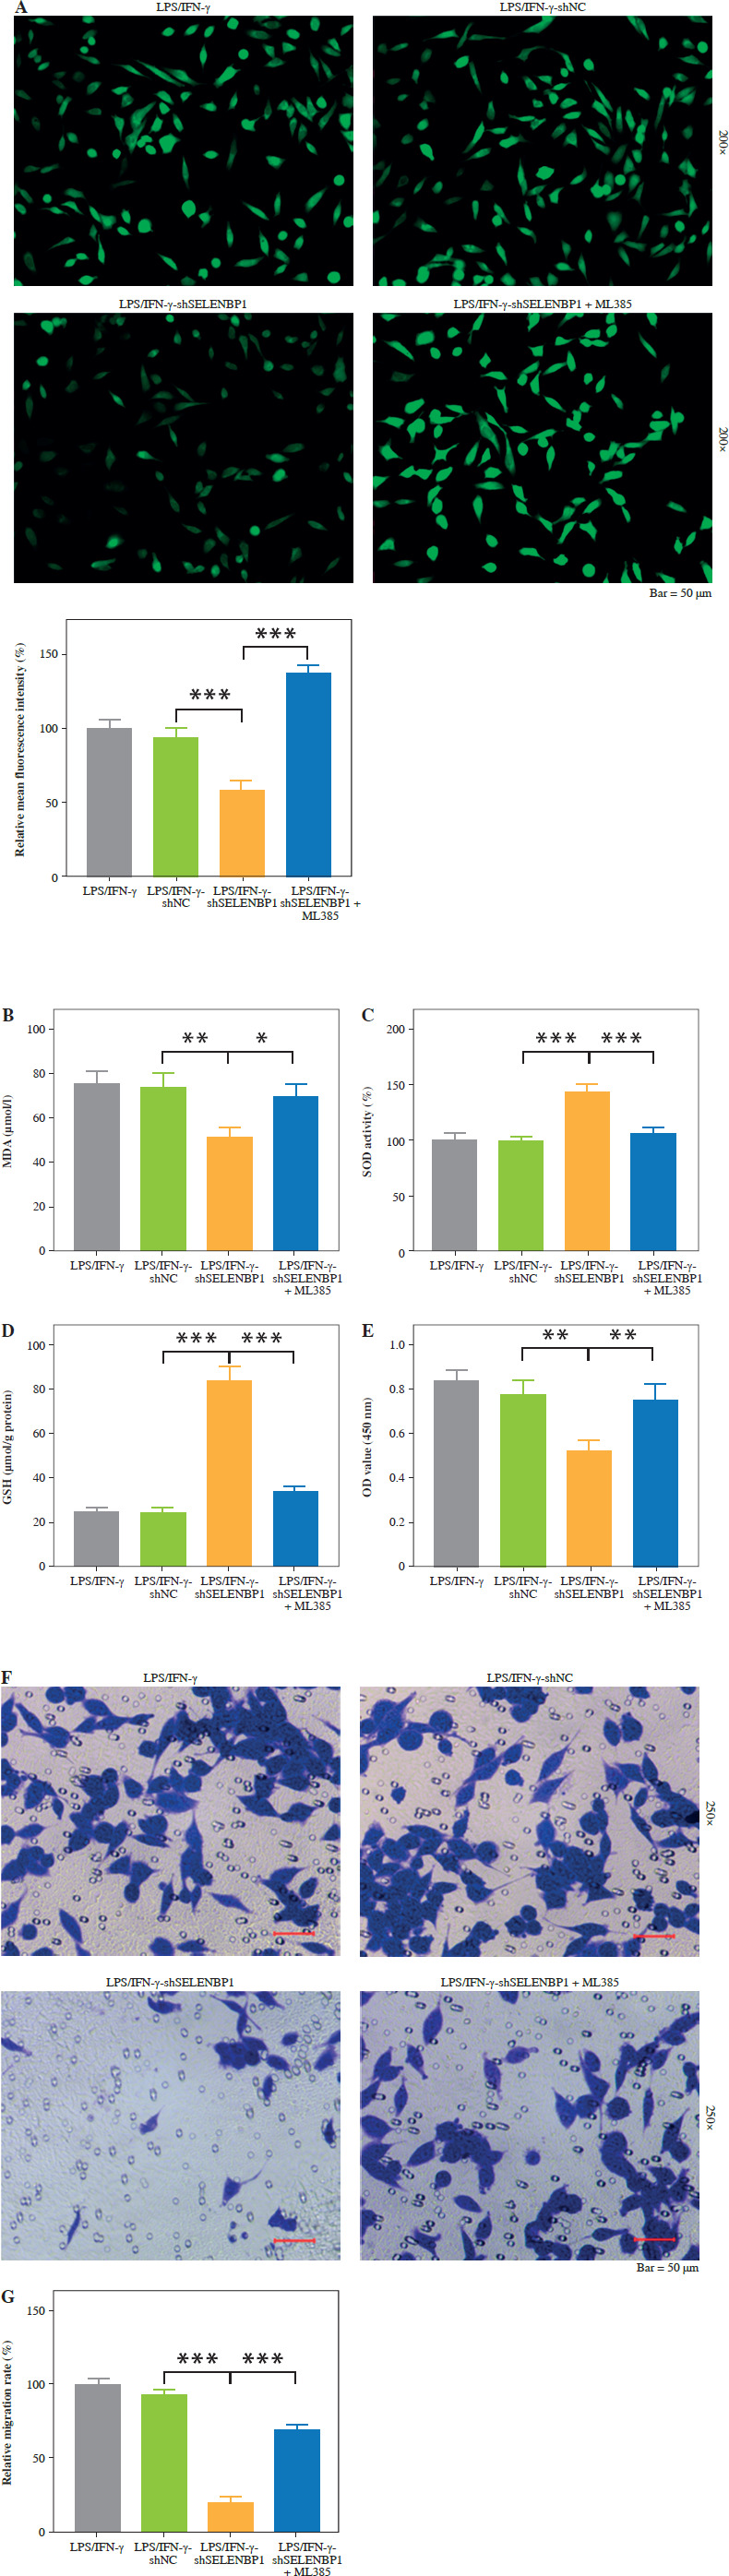
SELENBP1 knockdown inhibited ROS levels in THP-1 cells (p < 0.001, Fig. 4A). Subsequent treatment with ML385 reversed the effect caused by shSELENBP1, leading to an increase in ROS levels in THP-1 cells (p < 0.001, Fig. 4A). SELENBP1 knockdown inhibited MDA levels and increased SOD and GSH levels in THP-1 cells. Addition of ML385 treatment reversed the effects caused by SELENBP1 knockdown, resulting in increased MDA levels and decreased SOD and GSH levels (p < 0.001, Fig. 4B-D). Co-culture of LPS/IFN-γ-treated THP-1 cells with MH7A cells showed that SELENBP1 knockdown inhibited proliferation and migration of MH7A cells (p < 0.01, Fig. 4E-G). ML385 treatment reversed the inhibitory effects of SELENBP1 knockdown on the proliferation and migration of cells (p < 0.01, Fig. 4E-G).
Fig. 4
SELENBP1 silencing inhibits ROS production in macrophages and proliferation and migration of synovial fibroblasts by activating the NRF2 signal pathway. A) ROS levels in THP-1 cells of LPS/IFN-γ, LPS/IFN-γ- shNC, LPS/IFN-γ-shSELENBP1, and LPS/IFN-γ- shSELENBP1 + ML385 groups was detected by DCFHDA assay. Magnification 200×, scale bar 50 μm SELENBP1 silencing inhibits ROS production in macrophages and proliferation and migration of synovial fibroblasts by activating the NRF2 signal pathway. A) ROS levels in THP-1 cells of LPS/IFN-γ, LPS/IFN-γ-shNC, LPS/ IFN-γ-shSELENBP1, and LPS/IFN-γ-shSELENBP1 + ML385 groups was detected by DCFH-DA assay. Magnification 200×, scale bar 50 μm. B-D) Levels of malondialdehyde (MDA), superoxide dismutase (SOD), and glutathione (GSH) in THP-1 cells of LPS/IFN-γ, LPS/IFN-γ-shNC, LPS/IFN-γ-shSELENBP1, and LPS/IFN-γ-shSELENBP1 + ML385 groups was detected by assay kits. E) Proliferation of MH7A cells co-cultured with THP-1 cells of LPS/IFN-γ, LPS/IFN-γ-shNC, LPS/IFN-γ-shSELENBP1, and LPS/IFN-γ-shSELENBP1 + ML385 groups was detected by MTT assay. F, G) Migration of MH7A cells co-cultured with THP-1 cells of LPS/IFN-γ, LPS/IFN-γ-shNC, LPS/ IFN-γ-shSELENBP1, and LPS/IFN-γ-shSELENBP1 + ML385 groups was detected by transwell assay. Magnification 250×, scale bar 50 μm. Each experiment was repeated three times. *p < 0.05, **p < 0.01, ***p < 0.001
Discussion
Macrophages are essential immune cells known for their multifunctionality and diversity. They are characterized by their ability to phagocytose pathogens and cell debris, as well as to secrete various cytokines and chemokines, thus playing crucial roles in regulating inflammation and immune responses in human diseases such as inflammatory diseases, infections, tumors, and autoimmune diseases [12, 19, 20]. Studies have identified activated macro- phages in the synovial fluid as early markers of RA [21]. In the analysis of gene expression characteristics in synovial tissues of arthritis, SELENBP1 was revealed to be the core gene associated with the severity of arthritis disease [22]. Our study found SELENBP1 upregulation in RA and LPS/IFN-γ-induced SELENBP1 upregulation in THP-1 cells, indicating that via controlling SELENBP1, macrophages may help facilitate the occurrence of RA.
An imbalance in the generation of oxidative metabolic byproducts and their removal from the body results in increased levels of intracellular reactive oxygen species (ROS), which in turn cause lipid peroxidation, protein degradation, and DNA breakage. This situation is known as oxidative stress [23]. The pathophysiology of RA, as an autoimmune disease, is closely related to oxidative stress [7]. In RA patients, high levels of free radicals lower antioxidant levels and hasten the deterioration of bone [24]. Inflammation and oxidative stress are closely linked to RA since they both influence immune cell metabolism and foster inflammation [25]. Previous studies have shown that SELENBP1 knockdown increased mild stress-induced depression in mice and caused dysregulation of oxidative stress [26]. In our study, LPS/IFN-γ upregulated SELENBP1 in macrophages, resulting in increased ROS and MDA levels and decreased SOD and GSH levels, further evidence of SELENBP1’s critical function in controlling oxidative stress in RA pathogenesis.
Nrf2 is an important transcription factor that primarily controls the expression of antioxidant response genes, including antioxidant enzymes, detoxification enzymes, and electron transfer proteins, to shield cells from oxidative harm [27]. Nrf2 is a critical factor in the genesis and progression of many human illnesses such as inflammatory diseases, neurodegenerative diseases, cardiovascular diseases, and cancers. Studies have shown reduced Nrf2 activity in the joint synovium of RA patients, leading to decreased antioxidant capacity and increased sensitivity of synovial membrane cells to oxidative damage [28]. In addition, Nrf2 affects the development and clinical manifestations of RA by regulating the production of inflammatory factors and cell apoptosis pathways [29]. It has been reported that Nrf2 escapes degradation mediated by Keap1 (Kelch-like ECH-associated protein 1) by binding to Keap1, entering the nucleus, and activating the transcription of antioxidant genes [30]. In our study, we found that LPS/IFN-γ treatment of THP-1 cells induced a decrease in nuclear NRF2 levels and increased its levels in the cytoplasm, which was reversed by SELENBP1 knockdown. Previous research has shown that SELENBP1 can block NRF2 signaling [31], consistent with our findings. Our further experiments demonstrated that SELENBP1 induces ROS generation in THP-1 cells and increases oxidative stress levels in MH7A cells co-cultured with THP-1 cells.
It has been reported that induced reactive oxygen species promote fibroblast-like synovial cell proliferation and invasion [32]. In RA, synovial fibroblasts stimulated by inflammatory mediators exhibit excessive proliferation and invasive growth, leading to joint cartilage and bone destruction [5]. MIR31HG inhibits the proliferation and invasion ability of RA-related cells, regulating RA progression [33]. By inhibiting the proliferation of synovial fibroblasts and downregulating miR-126-3p/NF-κB, XIST suppresses the activity of the RA illness [34]. Our study confirmed that SELENBP1 induces synovial fibroblast proliferation and migration by activating NRF2 and promoting oxidative stress in macrophages. This suggests that macrophages may promote synovial fibroblast proliferation and migration by upregulating SELENBP1, blocking NRF2 signaling, activating ROS, and thereby accelerating RA progression. However, deeper mechanisms of action need further exploration. In addition, we plan to further validate the conclusions of this study in animal models in the future.
In conclusion, our study results indicate that SELENBP1 inhibition of NRF2 activation upregulates macrophage reactive oxygen levels, promotes synovial fibroblast proliferation and migration, and accounts for the pathophysiology of RA, providing potential targets and mechanistic explanations for developing new therapeutic strategies.