
Introduction
Colorectal cancer (CRC) is one of the most frequently diagnosed malignant tumours. Recently, CRC has been revealed to be closely associated with chronic inflammation after being observed in inflammatory bowel diseases such as ulcerative colitis or Crohn’s disease [1, 2]. Studies showed that CRC is positively correlated with obesity. Changes in insulin resistance, chronic inflammation, and changing growth factors or adipokine levels can effectively explain this relationship between obesity and CRC [3].
Apelin is a peptide expressed in various tissues such as brain, liver, kidney, heart, lung, gastrointestinal tract, adrenal gland, adipose tissue, and endothelium [4]. It acts through a series of signalling events that results in activation of the ERK and PI3K/Akt pathway, enhancing growth and survival in cells by binding to the apelin receptor (APJ), a G protein-coupled receptor [5]. Physiological functions of apelin include regulation of blood pressure, of insulin and histamine release, of angiogenesis, and of fluid and food intake [6]. High apelin levels have been associated with several cancer types, including cholangiocarcinoma, prostate, oral, ovarian, colon, endometrial, lung and gastroesophageal cancers, being a potential marker for cancer progression. Moreover, it also promotes metastasis due to increased proliferation, migration, invasion, and resistance to apoptosis [7]. Higher apelin and APJ gene expression levels were detected in hepatocellular carcinoma, in human colon adenomas and adenocarcinomas compared to healthy tissues [8, 9]. However, exogenous apelin has been found to exert anti-apoptotic effects on colon cancer cells [10]. Upon binding of apelin to its receptor, APJ, it can induce lymphatic invasion. Additionally, serum apelin levels were detected to be higher in obese endometrial cancer patients than in patients with a normal body mass index [11]. A study conducted on 30 patients diagnosed with high-grade serous ovarian cancer indicated lymph node metastasis caused by apelin immunoreactivity [12].
Macrophages are a very important component of the tumour microenvironment. M1-like macrophages show antitumor effects by activating inflammation, while M2-like macrophages support tumour formation and progression by stimulating cytokines [13]. The purpose of this research was to examine how macrophages in the cancer microenvironment are affected by cancer-derived apelin expression.
Material and methods
Cell culture
Proliferation of colon adenocarcinoma cell line SW480 (ATCC CCL-228) and murine macrophage cell line RAW 264.7 (ATCC TIB-71) in DMEM supplemented with 10% fetal bovine serum, 2 mM L-glutamine, and 1% penicillin-streptomycin was maintained in an incubator with 95% humidity and 5% CO2 until sufficient growth was achieved.
Co-culturing of SW480 and RAW264.7
SW480 cells were plated at a density of 5 × 10⁴ cells per well in a 6-well plate. Concurrently, 5 × 10⁴ RAW264.7 cells were seeded onto the 0.4 µm pore inserts. These two cells were co-cultured at 37°C with 5% CO2 for a duration of 24 hours. The RAW264.7 cell insertions were moved to six-well plates containing SW480 cells after a 24-hour period. Co-culture was ready for mRNA analysis at 48 hours.
Fluorescent microscopy imaging
The presence of TurboGFP in transduced SW480 cells was monitored using a Zeiss Colibri 7 fluorescent microscope (Germany). Images were taken at an emission of 475 nm and at an excitation of 555 nm on a 6-well plate. Afterwards, cell/colony numbers were counted from the obtained images.
Lentiviral transduction by shRNA
Silencing of the apelin gene was performed using the Dharmacon GIPZ lentiviral shRNA (Horizon Discovery, Compound Kingdom) system following the manufacturer’s protocol. 5 × 10⁴ SW480 cells were seeded per well in a 24-well medium plate. After 24 hours of incubation, the medium was withdrawn, and the cells were treated with shRNA lentiviral particles. The incubation medium was not supplemented with any serum or antibiotics during the transduction phase. Non-transduced SW480 cells served as the control during transduction, SW480 cells treated with plasmid-free viral particles were identified as the negative control, and SW480 cells treated with a combination of the V3LHS_401189 and V3LHS_401190 plasmids (Dharmacon, UK) were identified as the shRNA cells. After transduction, the medium (including serum and antibiotics) was added, and then the presence of green fluorescent protein (GFP) was detected by microscopic fluorescent examination at the end of 48 hours. The GFP signal indicated successful transduction. GFP expression was less than 90%. Therefore, background non-transduced cells were completely eliminated by puromycin. Cells were fed with selective medium every 2-3 days and GFP analysis was performed every day. Non-transduced cells were eliminated after 6-7 days. All cells obtained at the end of this period were considered as successfully transduced cells. Once the transduction efficiency reached an acceptable level, the level of the silenced gene was measured by qRT-PCR analysis.
RNA isolation and cDNA synthesis
Total RNA isolation from cancer cells and macrophages, which were removed appropriately at the end of the desired periods and applications in the indirect culture system, was carried out using TRIzol in accordance with the manufacturer’s instructions. cDNA synthesis from quality-controlled RNA samples was performed using a kit (Bio-Rad iScript cDNA Synthesis, USA) according to the manufacturer’s instructions.
Quantitative real-time PCR (qRT-PCR) analysis
Primer designs of target genes were carried out using the Primer Quest (http://eu.idtdna.com/home/home.aspx) program. To determine gene expression differences in direct and indirect co-cultures of SW480 and RAW264.7, a Bio-Rad CFX Connect device was used for qRT-PCR analysis. The list of primers for genes of interest is presented in Table 1 [13]. The reaction was carried out in accordance with the protocol that we had previously optimized [13]. GAPDH was used as an internal control to normalize qRT-PCR data.
Table 1
List of primers used in this study
Enzyme-linked immunosorbent assay (ELISA)
Protein levels of pro-inflammatory and anti-inflammatory cytokines, which were found to have significant changes following qRT-PCR analysis, were further analysed via an ELISA (Shanghai SunRed Biological Technologies, China). Optical density (OD) was measured at 450 nm using an ELISA reader (Epoch, USA). Determination of changes in the levels of cytokines provided information about the transformation of macrophages into M1 or M2 type.
Statistical analysis
Using the 2-ΔΔCt method, the relative expression level of each target gene was calculated in the study after being standardized with the reference gene. A multiple t-test was used to assess each group’s levels of gene expression and cytokine levels using the GraphPad Prism version 9.2.0 software. A p-value of less than 0.05 was considered as statistically significant.
Results
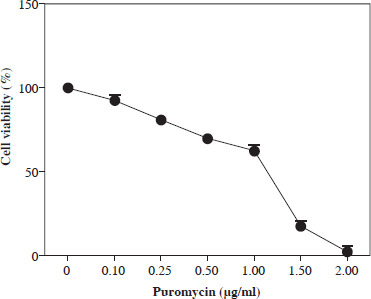
Kill curve analysis in puromycin applied SW480 cells
Previous studies showed that puromycin, a selective antibiotic for mammalian cells, is frequently and safely used at 2-10 µg/ml. In this study, kill curve analysis was performed for SW480 cells at and below this dose range, and doses of 2 µg/ml and above were found to be cytotoxic for all cells. However, it was determined that a dosage of 1.5-2 µg/ml can be applied as a selective dose in non-transduced SW480 cells (Fig. 1).
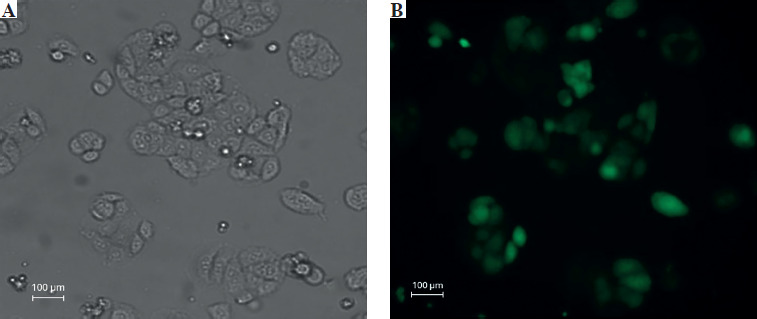
Fluorescent microscopic examination of TurboGFP protein expression in transduced cells
The transduction unit was calculated by counting each cell or colony with TurboGFP irradiation. In this study, the transduction unit was found to be 200,000 (TU/ml). TurboGFP fluorescence, which was observed as the first sign of transduction, was detected 72 hours after transduction. In cells under low radiance (> 90%), apelin shRNA transduced SW480 cells were separated by puromycin selection for approximately 10 days (Fig. 2).
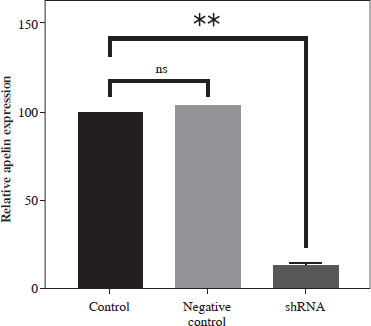
Control of apelin expression in SW480 cells transduced with shRNA by qRT-PCR analysis
Apelin expression of transduced and non-transduced SW480 cells was determined by qRT-PCR analysis. It was observed that the combined application of plasmids achieved 85% silencing compared to the control cells (p < 0.01; Fig. 3). A non-significantly higher value was detected in the negative control compared to the control (p > 0.05).
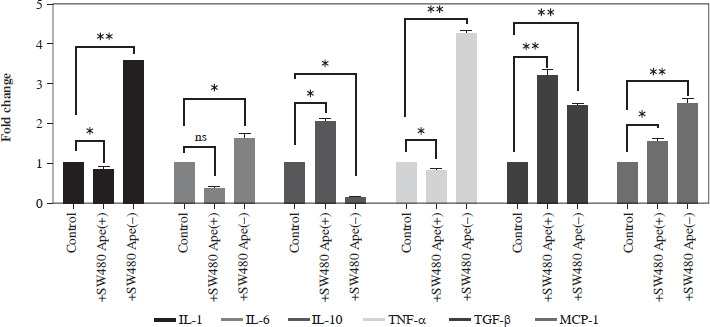
Expression changes of inflammation-related genes after co-culturing in RAW264.7 cells
The expression levels of cytokines in macrophages, which were co-cultured with apelin gene-suppressed SW480 cells, were examined via qRT-PCR analysis, and the relative fold changes are illustrated in Figure 4. IL-1 expression was significantly lower in the presence of apelin, while it was significantly higher in the absence of apelin compared to the control (p < 0.05; Fig. 4). Although IL-6 expression level was non-significantly downregulated in the presence of apelin, it was significantly upregulated in the apelin-knockdown cells (p < 0.05). Gene expression changes of both pro-inflammatory cytokines indicated that macrophage cells change the cytokine profile in response to apelin absence. Similarly, the expression levels of TNF-α and TGF-β were higher in apelin-suppressed cells compared to control cells. The TNF-α level was lower (p < 0.05) while the TGF-β level was significantly higher (p < 0.01) in the presence of apelin compared to the control (Fig. 4). MCP-1, which is an effective cytokine in the recruitment of macrophages, was dramatically upregulated regardless of the presence (p < 0.05) or absence (p < 0.01) of apelin (Fig. 4).
Expression changes of cell surface markers for macrophages in RAW264.7 cells
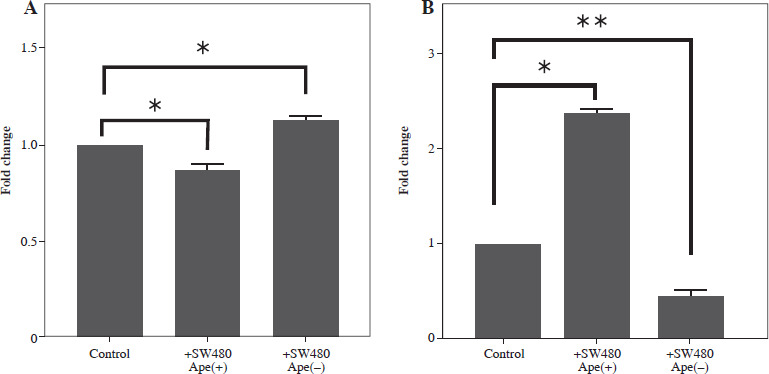
Gene expression levels of cell surface markers after co-culture of macrophage cells with ape (+) and ape (–) SW480 cells were detected via qRT-PCR analysis. Although CD86 expression was significantly lower in macrophages co-cultured with the ape (+) group, CD163 expression was higher in the presence of apelin as compared to control cells (p < 0.05; Fig. 5). In the ape (–) group, where apelin was suppressed, CD86 was significantly higher (p < 0.05), while CD163 was significantly lower (p < 0.01) compared to control cells (Fig. 5).
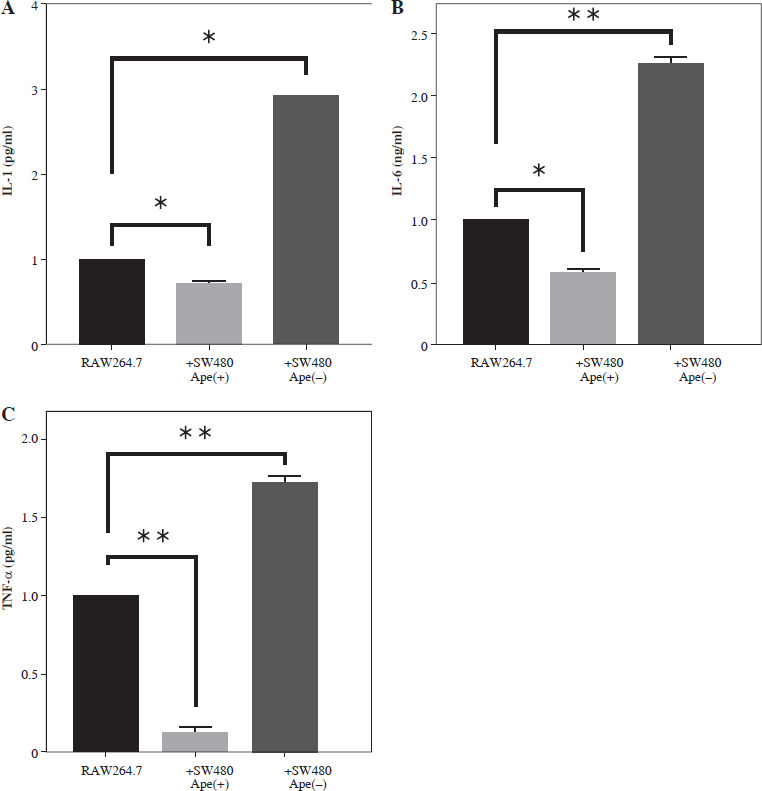
Measurement of cytokine levels via ELISA assay
The expression levels of interleukin (IL)-1 and IL-6 at the protein level were lower in RAW264.7 macrophage cells co-cultured with ape (+) cells compared to control cells (p < 0.05; Fig. 6). However, IL-1 and IL-6 protein levels were higher in RAW264.7 cells co-cultured with SW480 cells in which the apelin gene was suppressed (p < 0.01; Fig. 6). Similarly, tumor necrosis factor α (TNF-α) protein levels were also lower in the presence of apelin (p < 0.01) and higher in the absence of apelin (p < 0.01) compared to control cells (Fig. 6).
Discussion
Macrophages are cells that suppress inflammation in the tissues upon induction of an immune response. Through their high plasticity capacities, macrophages are involved in the formation, maintenance, and completion of the inflammatory response [14]. They have an important role in maintenance of homeostasis. While M1 macrophages provide the formation of a mutagenic microenvironment, M2 macrophages promote tumour progression [15]. The involvement of macrophages in the cancer niche acts as a protective barrier to kill tumour cells, explaining their potential roles in cancer therapy. For this purpose, it is critically important to elucidate the communication between cancer cells and macrophages.
Apelin is expressed in various tissues such as the brain, liver, kidney, heart, lung, gastrointestinal tract, adrenal gland, adipose tissue, and endothelium [4]. Apelin and its receptor, APJ, were reported to have elevated mRNA and protein levels in CRC tissues compared to normal tissues [16]. Immunohistochemical data have also indicated the overexpression of apelin and APJ in human colon adenomas and adenocarcinomas [10]. Similar to these results, our study also showed high apelin expression in colon cancer and changed macrophage polarity in the cancer microenvironment. According to our data, it was observed that IL-1, IL-6 and TNF-α protein expression levels were elevated when the apelin gene was suppressed using a shRNA lentiviral vector. Our results suggested that the pro-inflammatory response was activated in the absence of apelin. However, the protein levels of these cytokines significantly decreased in the presence of apelin, making the environment immunosuppressive.
In co-cultured cells, the anti-inflammatory effects of apelin through the suppression of pro-inflammatory cytokines have been demonstrated in in vitro and in vivo studies. It has been reported that apelin exhibits anti-inflammatory functions by reducing TNF-α and IL-6 in rat peritoneal macrophages [17, 18]. In this study, TNF-α and IL-6 gene expression was suppressed in ape (+) cells (Fig. 4), which was compatible with the literature. In this case, it is possible that apelin has anti-inflammatory properties that downregulate the functions of activated macrophages.
Interleukin 10 is expressed in both M1 and M2 macrophage types, but the level in M1 type macrophages was significantly lower. It has a key role in the formation of the immunosuppressive microenvironment. Transforming growth factor β (TGF-β) is released from epithelial cells under normal physiological conditions and acts as a tumour suppressor. TGF-β is involved in the regulation of cell proliferation, apoptosis, differentiation and motility. TGF-β also limits proliferation in different tissues such as thyroid, hepatocytes, colon, and breast epithelial cells [19]. Increased IL-10 and TGF-β causes facilitated angiogenesis and increase of the growth and size of tumours [20]. The elevated IL-10 and TGF-β mRNA transcripts in the ape (+) group show that they direct the process in the favour of tumour progression. VEGF and MCP-1 proteins were also detected in the microenvironment of breast cancer cells [21, 22]. Moreover, MCP-1 enables the recruitment of M2-type macrophages to the tumour microenvironment [23]. In this study, it was observed that MCP-1 gene expression was significantly elevated in the presence of apelin, suggesting a potential role of apelin in macrophage polarization.
The functions of apelin in the cancer microenvironment through macrophages must be further clarified, and its impact on all cell types must be examined. It has been reported that the suppression of apelin in head and neck cancer increases the pro-inflammatory response of co-cultured macrophages [13]. The transformation of macrophages into M2 type creates an immunosuppressive environment providing appropriate conditions for cancer progression. Similarly, recent cancer-associated fibroblast (CAF) studies have also indicated that the suppression of apelin in cancer cells alters the cancer microenvironment, promoting tumour growth, invasion, and metastasis [24]. The undeniable role of apelin in the cancer microenvironment seems to be a promising strategy for cancer treatment.