
Introduction
Cancer, an insidious and devastating disease, is characterized by the uncontrolled growth and division of cells [1]. The occurrence of tumors involves a complex interplay of molecular biological mechanisms, encompassing gene mutations, chromatin remodeling, epigenetic alterations, abnormalities in signal pathways, and immune evasion [2]. According to the World Health Organization (WHO), millions of individuals worldwide receive a diagnosis of malignant neoplasms annually [3]. With the advancement and extensive implementation of gene editing technologies such as targeted therapy, immunotherapy, liquid biopsy, and CRISPR-Cas9, modern cancer treatment has evolved into a more personalized and precise approach [4]. Nevertheless, the field of cancer treatment continues to present significant challenges.
Immunotherapy is a therapeutic approach that harnesses the host’s immune system to discern, target, and suppress neoplastic cells [5]. Immune checkpoint inhibitors (ICIs) facilitate activation of the immune system against malignant tumors, while CAR-T therapy involves genetic engineering of T cells to confer them with tumor-targeting capabilities before reinfusion into the patient [6]. The advantages of immunotherapy lie in its targeted and persistent antitumor effects, as well as its potential to induce long-term immune memory. It not only offers a novel therapeutic option but also demonstrates significant efficacy in advanced, refractory, or metastatic tumors [7]. However, it is worth noting that the effectiveness and indications of immunotherapy for different tumor types and patient populations are still being elucidated. The application of sequence data analysis facilitates in comprehensively analyzing the patterns of tumor development, gaining a more precise understanding of the molecular characteristics, and providing a scientific foundation for clinical decision-making [8].
The polycomb repressive complex 1 (PRC1) is a multi-subunit complex, serving as a crucial epigenetic modification complex [9]. It exerts its function by binding to specific chromatin sites and mediating histone modifications [10]. Aberrant activation or upregulation of PRC1 has been implicated in the pathogenesis and progression of various malignancies including myeloma [11], pancreatic cancer [12], and melanoma [12]. This intricate complex plays pivotal roles in determining cell fate, regulating cell proliferation and differentiation, maintaining tumor cell stemness, as well as promoting metastasis through repression of tumor suppressor genes while enhancing the expression of oncogenes [13]. It is noteworthy that PRC1 can facilitate evasion from the immune system and enhance immune tolerance by maintaining stemness and destroying antigen presentation and immune detection. Therefore, this study investigated both clinical and biological functions of PRC1, and explored its relationship with immunotherapy resistance, providing novel insights and a theoretical foundation for understanding PRC1.
Material and methods
PRC1 expression in pan-cancer
In this study, we acquired RNA sequence data encompassing members of PRC1 from The Cancer Genome Atlas (TCGA) database. The Cancer Genome Atlas was accessed in July 2023, from the Genomic Data Commons (https://gdc.cancer.gov/). The datasets utilized in this study were obtained from TCGA and were generated using RNA sequencing (RNA-Seq) on the Illumina HiSeq platform. Standard quality control procedures were applied to ensure high-quality reads, including filtering of low-quality reads and alignment to the reference genome. Bioinformatic analyses were performed using R software, with differential expression analysis conducted through DESeq2, and data normalization was applied using the normalization method to adjust for specific biases. To complement the control group, we further obtained the data from the GTEx database. The heat map displayed log2 fold change representing the expression difference of PRC1 in pan-cancer, denoted by “*”, “**”, “***” for p < 0.05, < 0.01, < 0.001, respectively. Simultaneously, clinical information such as age, gender, tumor stage, and pathological type; mutation information (mutated genes, types and locations); and survival information was also obtained from the TCGA database. The protein-protein interaction patterns of PRC1 were constructed based on the String database. The abbreviations and corresponding full names involved in this article are explained in Suppl. Table 1.
Table 1
Cox analysis of polycomb repressive complex 1 (PRC1) across pan-cancers
To validate the bioinformatics results at both the mRNA and protein levels, we employed a two-pronged approach. First, quantitative PCR (qPCR) was used to assess the mRNA expression levels of the PRC1 complex. Tumor tissues and corresponding adjacent normal tissues were collected from 10 patients for each of the 12 different types of cancer, including BRCA, CESC, COAD, DLBC, ESCA, KIRC, LIHC, LUAD, PRAD, STAD, THCA, and UCEC. The primer sequences used for qPCR are presented in Suppl. Table 2. The qPCR was performed in a total volume of 20 µl, containing 10 µl of SYBR Green Master Mix, 0.5 µM of each primer, and 1 µl of cDNA template. The thermal cycling conditions were as follows: initial denaturation at 95°C for 10 minutes, followed by 40 cycles of 95°C for 15 seconds and 60°C for 1 minute. Relative expression levels were calculated using the ΔΔCt method, with GAPDH as the reference gene. Second, we utilized immunohistochemistry (IHC) images from the Human Protein Atlas (HPA) database (https://www.proteinatlas.org/) to evaluate the protein expression levels of these PRC1 genes. This study was approved by the Ethics Committee of the Chinese People’s Liberation Army (PLA) General Hospital under protocol number No. S2021-629-01; No. S2022-610-01; No. C2023-005-01; No. S2022-299-01; No. S2019-364-02; and No. KY2022-001. All participants were obtained from the Chinese People’s Liberation Army (PLA) General Hospital and provided written informed consent prior to enrollment in the study. The patient characteristics for this study are included in Suppl. Table 3. Furthermore, according to the HPA terms of use, researchers are permitted to include public images in academic publications as long as proper credit is attributed to the HPA.
Prognostic survival analysis
Univariate Cox analysis was conducted on PRC1. Four clinical outcomes were assessed: overall survival (OS), disease-specific survival (DSS), disease-free interval (DFI), and disease-free survival (DFS). A significance level of p < 0.05 was considered statistically significant. Subsequently, another prognostic validation was performed using the PrognoScan database (http://www.prognoscan.org/) [14]. We cross-validated the association between PRC1 and survival expectations across independent datasets. The Cox p-value threshold of < 0.05 was applied for statistical significance.
Clinical characteristics, stemness, and pharmacological responsiveness
We utilized the DNA methylation-based stemness index (DNAss) and mRNA expression-based stemness index (RNAss) to examine the association between tumor cell stemness and PRC1 expression. Henceforth, we initially estimated DNAss and RNAss values for each sample using the one-class logistic regression (OCLR) algorithm followed by Spearman correlation analysis between DNAss scores and expression levels of the PRC1 complex [15]. Through the GSCA (Gene Set Cancer Analysis) website, we can assess the correlation between PRC1 and clinical progression in pan-cancer [16]. By integrating the results from GDSC (Genomics of Drug Sensitivity in Cancer) [17] and CTRP (Cancer Therapeutics Response Portal) [18], this platform provides valuable insights for tumor drug resistance to identify novel therapeutic targets and develop personalized treatment strategies. The integrated datasets facilitate analysis of the relationship between drug susceptibility and specific genetic or genomic features.
Genetic alteration analysis
We retrieved mutation data of the relevant genes from the TCGA database and subsequently computed their mutation frequency, type (e.g., missense mutation, deletion, insertion), and distribution across different cancer types. The mutational landscape of the PRC1 complex was elucidated in pan-cancer and gene mutation patterns compared among these malignancies.
Tumor immunotherapy of PRC1
The current immunotherapy regimens primarily encompass checkpoint inhibitors and CAR-T cell therapy. Checkpoint inhibitors are a class of drugs that enhance immune system efficacy against tumor cells by blocking inhibitory signaling pathways such as PD-1/PD-L1. The ROC Plotter website (https://www.rocplot.org/) is a widely used tool for evaluating classification model performance and response to immunotherapy. The area under the curve (AUC) was employed to predict the response of PRC1 to immunotherapy. Subsequently, we employed the Kaplan-Meier Plotter website (https://kmplot.com/analysis/) to generate survival curves for patients treated with immunotherapy. We leveraged the two databases to elucidate the association of PRC1 and immunotherapy prognosis. Furthermore, the effect of BMI1 on the sensitivity of the aforementioned immunotherapies (PD-1, PD-L1, and CTLA-4 inhibitors) was also evaluated.
Tumor microenvironment and immune checkpoints
The TIMER database (https://cistrome.shinyapps.io/timer/) provides the association between the PRC1 and specific immune cell subpopulations. The TIDE database (http://tide.dfci.harvard.edu/), on the other hand, elucidates the functional mechanisms of immune cells within tumors, offering valuable insights into how members of the PRC1 contribute to T cell dysfunction and exclusion. The correlation between BMI1 and immune checkpoints was determined using the TCGA database through Pearson correlation analysis.
Enrichment analysis of BMI1 in pan-cancer
Through the GEPIA (Gene Expression Profiling Interactive Analysis) website (http://gepia.cancer-pku.cn/), comprehensive information regarding other genes associated with BMI1 gene expression across various cancer types can be obtained. For BMI1, we identified the top 200 genes exhibiting the highest Pearson correlation coefficient (PCC) in each tumor and defined them as co-expressed genes of BMI1. Subsequently, functional enrichment analysis of these BMI1-related genes was performed using Metascape (https://metascape.org) and Reactome (https://reactome.org/) websites to gain insights into the underlying biological pathways and molecular functions involving BMI1. Furthermore, the patient cohort for each tumor type was stratified into high and low expression groups based on the median value of BMI1 expression, followed by transcriptome analysis to identify differentially expressed genes between these two groups. Genes showing statistically significant differences along with their corresponding logFC values were extracted for single-gene GSEA analysis.
Results
Expression pattern of PRC1 in pan-cancer
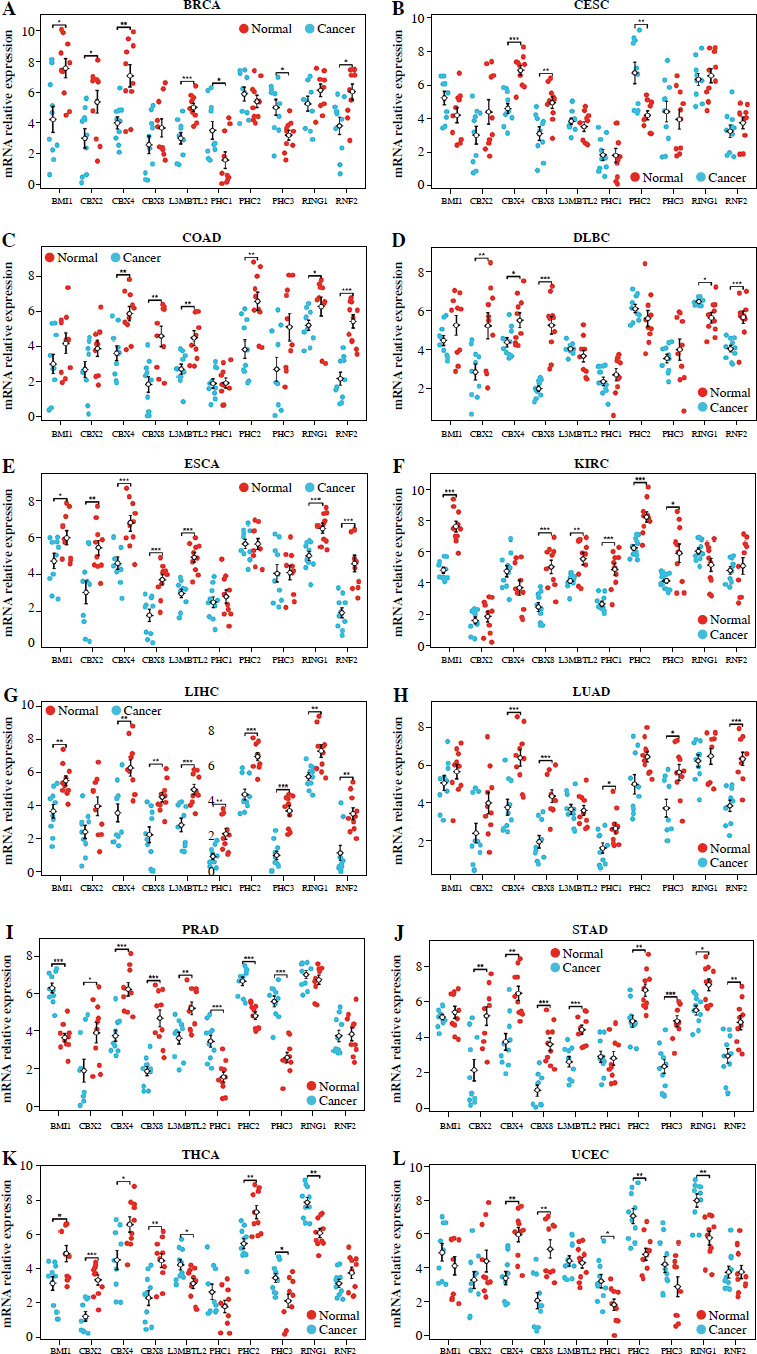
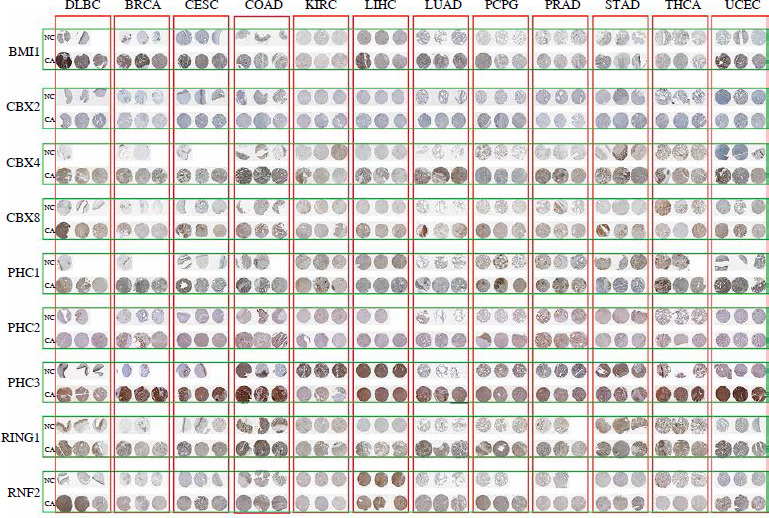
We conducted a comprehensive analysis of the PRC1 complex to investigate its expression in pan-cancer. As indicated by the results shown in Figure 1A, PHC2 and RING1 exhibited high expression levels, while CBX2 showed low expression levels across pan-cancers. Additionally, all PRC1 complex members revealed consistent abnormal increases in CHOL, COAD, ESCA, LIHC, and STAD (Suppl. Table 4). Except for CHOL, GBM, KIRC, and PCPG, PHC1 in cancer tissues was lower than the normal tissues. RNF2 and CBX8 were abnormally highly expressed in almost all tumor types except KICH (Suppl. Fig. 1). To further confirm the bioinformatics results, we collected tumor tissues and corresponding control tissues from 10 patients for each of the 12 different types of cancer: BRCA, CESC, COAD, DLBC, ESCA, KIRC, LIHC, LUAD, PRAD, STAD, THCA, and UCEC (Fig. 2A-L). It can be observed that the outcomes of qPCR are largely in accordance with the trend of RNA-seq, a point worthy of attention. Notably, both CBX4 and CBX8 exhibit strikingly high expression in the acquired tumor types, whereas nearly all members of the PCR1 complex display significant upregulation of expression in LIHC tumors. The immunohistochemistry (IHC) images from the Human Protein Atlas (HPA) database revealed notable differences in the protein expression levels of PRC1 complex genes between tumor and normal tissues (Fig. 3). In contrast to normal tissues, BMI1, CBX4, CBX8, and PHC3 manifest strikingly elevated expression in pan-cancer; nonetheless, the expression level of CBX2 protein aligns with the outcomes derived from RNA-seq and qPCR, featuring the lowest expression level within the PRC1 complex. When analyzing diverse tumor types, considerable consistency is observed in the expression patterns of PRC1 complex members in COAD, LUAD, LIHC, and UCEC tumors, all of which exhibit relatively abundant expression in tumor tissues. Interestingly, in the overall pattern of PRC1, we discovered peak expression levels in COAD, LIHC, and UCEC (Suppl. Table 4). Considering the protein interaction matrix for PRC1 (Fig. 1B), it is reasonable to hypothesize that the above tumors exhibit high activation of the molecular biological function. GO enrichment analysis indicated that negative regulation of G0 to G transition, negative regulation transcription, DNA-templated, and histone ubiquitination are key molecular biological functions (Fig. 1C).
Fig. 1
Differential expression, coexpression, and biological activity of PRC1 in pan-cancer. A) Heatmap exhibiting the expression level of polycomb repressive complex 1 (PRC1) in TCGA tumor types compared to adjacent normal tissues and GTEx tissues; the gradient colors represent the log fold change (logFC) value. (Red points indicate high expression, while blue points indicate low expression.) B) Protein-protein interaction (PPI) network constructed among PRC1 members. C) GO enrichment analysis of PRC1
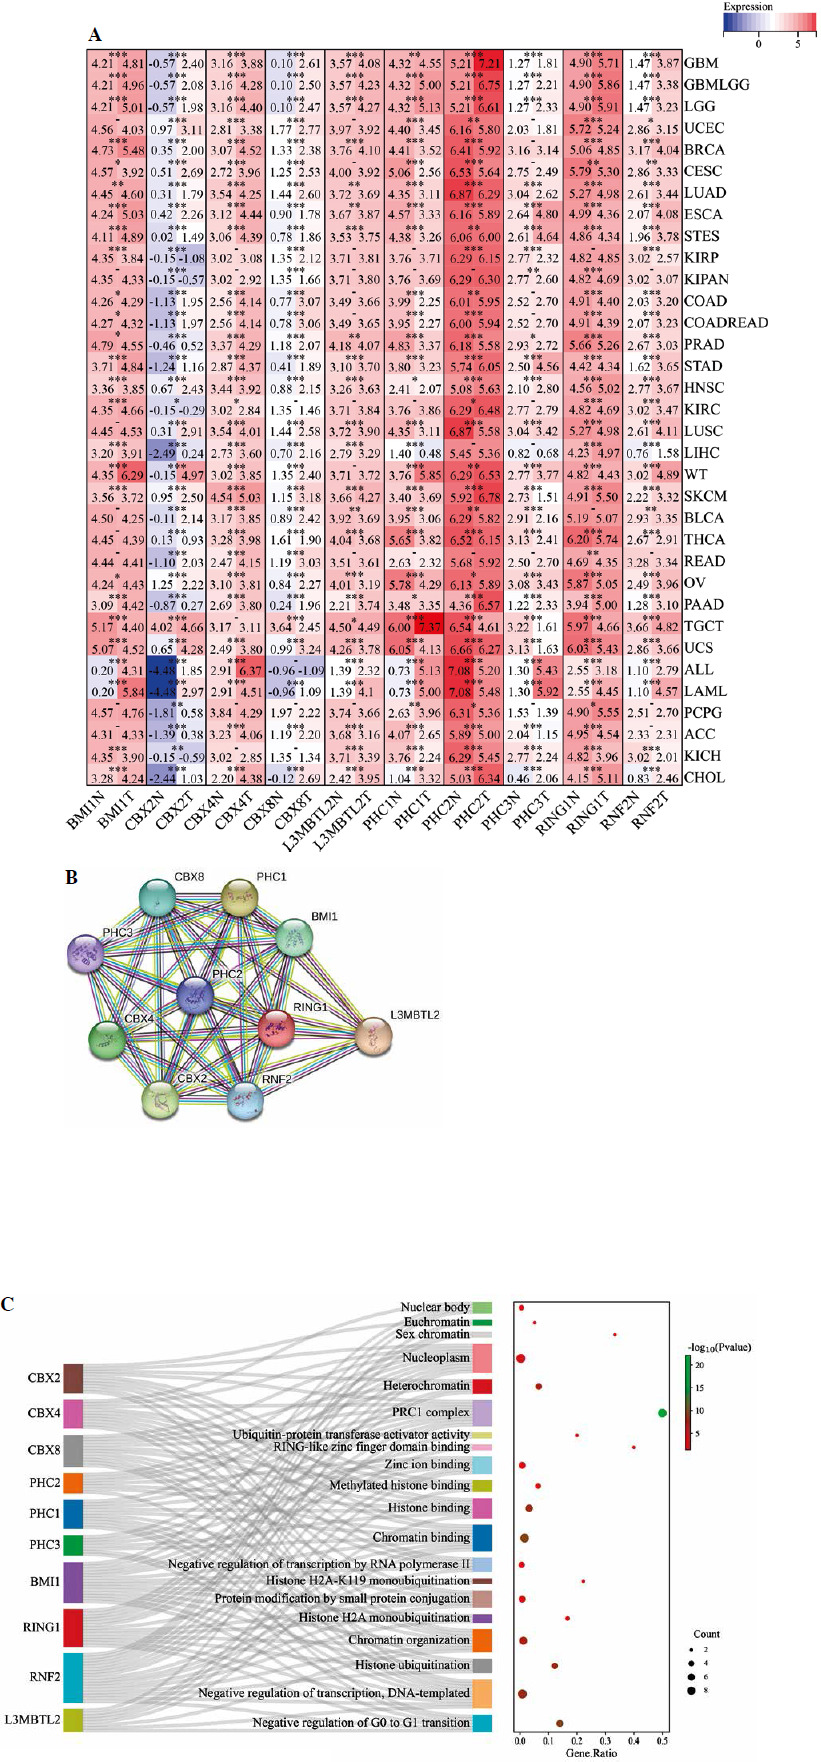
Fig. 2
Quantitative PCR (qPCR) analysis of PRC1 complex gene expression in tumor and adjacent normal tissues. A-H) mRNA levels of PRC1 complex were quantified in tumor tissues and corresponding normal tissues collected from patients across BRCA, CESC, COAD, DLBC, ESCA, KIRC, LIHC, LUAD. Data are presented as mean ± standard deviation (SD) for each gene, with significant differences between tumor and normal tissues indicated by *p < 0.05, **p < 0.01, and ***p < 0.001 Quantitative PCR (qPCR) analysis of PRC1 complex gene expression in tumor and adjacent normal tissues. I-L) mRNA levels of PRC1 complex were quantified in tumor tissues and corresponding normal tissues collected from patients across PRAD, STAD, THCA, and UCEC. Data are presented as mean ± standard deviation (SD) for each gene, with significant differences between tumor and normal tissues indicated by *p < 0.05, **p < 0.01, and ***p < 0.001
Prognostic value of PRC1 in pan-cancer
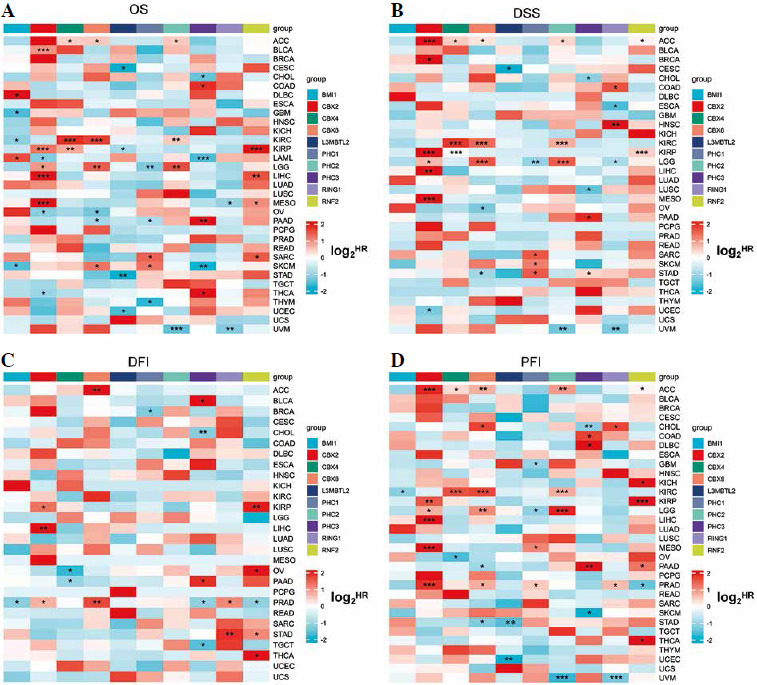
Univariate Cox analysis was conducted to identify the prognostic value of PRC1 in TCGA and GEO databases. Four clinical outcomes – OS, DSS, DFI, and progression-free interval (PFI) – were employed in the analysis. Notably, different members exhibited distinct effects on prognosis. For instance, BMI1 and RNF2 were identified as significant risk factors for COAD, OV, and LUAD in terms of OS (Fig. 4A). We also observed that BMI1 and PHC3 can persistently impair the DSS of COAD (Fig. 4B). Additionally, CBX2 was validated as a risk factor for BRCA. Surprisingly, CBX4, PHC1, PHC3, and RNF2 consistently exhibited protective factors against recurrence in BRCA (Fig. 4C). CBX2 emerged as a significant risk factor for BRCA, LUAD, and SKCM (Fig. 4D). PHC2 demonstrated a significant risk association with LUAD in both prognostic databases. Similarly to other members, PHC3 primarily influenced the survival expectancy of COAD and BRCA patients. However, we believe that obtaining consistent results from independent databases adds credibility to our findings. The other survival outcomes from GEO are presented in Table 1 and Suppl. Tables 5-7. When considering all these results collectively, it becomes evident that the majority of PRC1 members showed statistical associations with worse overall survival in the COAD cohort. Combined with the differential analysis, we revealed a synergistic effect of the PRC1 complex in promoting tumor progression in COAD.
Fig. 4
Univariate Cox analysis of PRC1 in pan-cancer of TCGA database. Heatmap illustrating prognostic risk factors associated with PRC1 in tumor patients. (Risk factors are depicted in red, while protective factors are represented in blue.) A) Overall survival (OS), B) disease-free survival (DSS), C) disease-free interval (DFI), D) progression-free interval (PFI)
Correlation between PRC1 and tumor stage, tumor stemness, and drug resistance
Differential expression between stages was utilized to assess the role of PRC1 in the progression of pan-cancers. As shown in Suppl. Fig. 2A, the findings suggest that PRC1, particularly in relation to clinical stage, plays a significant role in KIRC and KIRP. CBX2 exhibits robust involvement in KIRP and OV across different clinical stages, while displaying certain variations in pathological stages within KIRP and BRCA. In the case of KIRC and TGCT, BMI1 and L3MBTL2 demonstrate distinct pathological expression (Suppl. Fig. 2C). RNF2 displays high variability across both clinical and pathological stages of KIRP. Notably, the significant impact of CBX4 indicated its association with the progression of various cancers including LIHC, MESO, KIRP, SKCM, LUAD, STAD, ESCA, KIRC, CHOL, ACC, BLCA, BRCA, HNSC, and COAD. Consequently, in COAD, the pathological stage and the expression of BMI1, PHC3, RING1, RNF2, CBX2, PHC2, CBX8, and CBX4 exhibited a significant upward trend (Suppl. Fig. 2B). However, the members of PRC1 displayed an opposite tendency in THCA. Furthermore, BMI1 exhibited the strongest positive correlation with DNAss among all members of the PRC1 complex (Suppl. Fig. 3A), while CBX2 showed consistent positive associations with RNAss across most types of tumors (Suppl. Fig. 3B). Supplementary Fig. 4A and B illustrates the correlation between drug sensitivity and mRNA expression of PRC1 complex genes. Blue bubbles indicate negative correlations, while red bubbles represent positive correlations; the intensity of color reflects the strength of correlation. Bubble size is positively associated with FDR significance, and a black outline border indicates an FDR value ≤ 0.05. The results obtained from both databases consistently demonstrate the predictive power of gene expression levels in determining drug sensitivity. With the exception of PHC2, there exists a negative correlation between drug sensitivity and expression of PRC1 complex genes, particularly for CBX2, BMI1, RNF2, and L3MBTL2. Conversely, PHC2 expression shows a positive association with drug sensitivity except for trametinib and selumetinib treatments. Considering the synergistic effects of drug resistance within PRC1 complex genes and their resistance to almost all drugs except PHC2, it is reasonable to hypothesize that further investigation into the role of PRC1 complex could effectively address side effects related to drug resistance in tumor patients and improve their survival.
Genetic mutation analysis
We further analyzed the frequency and types of variations in the PRC1 gene complex across multiple cancer types using data from the TCGA database. The results revealed that UCEC, SKCM, and COAD exhibited the highest frequency of SNV mutations (Suppl. Fig. 5A). Among these tumors, PHC3 had the highest number of SNV changes with respective counts of 28, 19, and 8. Notably, UCEC displayed the highest mutation rate at 18.3% (Suppl. Fig. 5B). Additionally, we observed that missense mutations, nonsense mutations, and frame shifts were among the main genetic alteration types identified in this study. The PHC1/2/3 genes showed particularly high mutation rates within the PRC1 complex. Furthermore, similar alterations were also detected in SKCM and COAD (Suppl. Fig. 5C, D). Based on their impact on prognosis and clinical features, members of the PRC1 complex were found to be associated with tumor stemness and purity while exhibiting a tendency to mutate in specific cancer types consistent with their clinical characteristics.
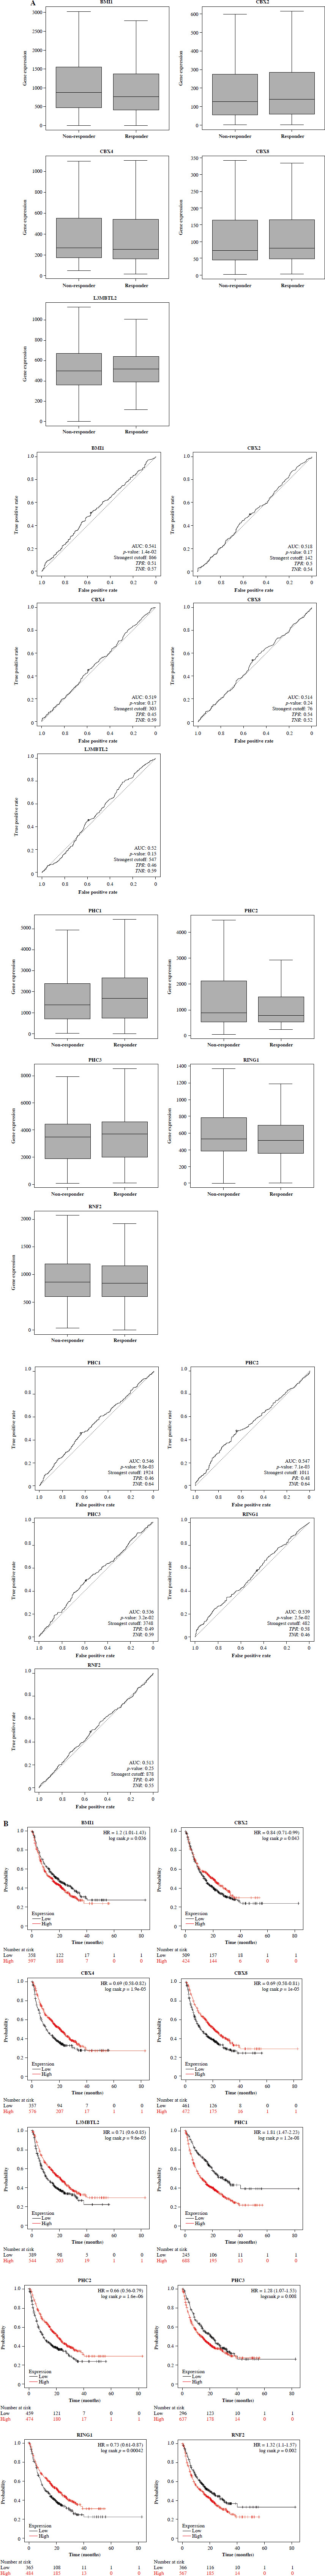
PRC1 and immunotherapy in pan-cancer
To evaluate the impact of PRC1 on tumor immunotherapy, we comprehensively assessed this gene using three indicators: differential expression analysis between the responders and non-responders, ROC diagnosis of immune effect, and Kaplan-Meier (K-M) survival analysis of the patients treated with immunotherapy. Consistent results across all three analyses indicate that this gene holds significant guiding value (Fig. 5A, B). Among the five genes with statistical difference, BMI1, PHC2, and RING1 exhibited higher expression levels in non-responders compared to responders. In K-M analysis, we assessed the prognostic impact of PRC1 genes on immunotherapy outcomes in pan-cancer. BMI1, PHC1, PHC3, and RHF2 were identified as risk factors while other members acted as protective factors for the immunotherapy response. Considering the three outcomes collectively, only BMI1 revealed consistent statistical reversal of immunotherapy efficacy. Its high expression level can confer resistance to immunotherapy in pan-cancer and significantly reduce the expected survival.
BMI1 and tumor microenvironment
Immune checkpoint inhibitors constitute a novel class of anticancer drugs that are utilized for treating various cancers. These agents function by impeding inhibitory signaling pathways in the immune system to enable it to attack cancer cells. Normally, the immune system maintains an equilibrium of immune response through certain signaling pathways to prevent excessive responses; however, cancer cells can exploit these pathways to evade attacks from the immune system. The role of ICIs is to hinder these signaling pathways’ activity and enhance the ability of the immune system to target malignant cells. Currently available ICIs include PD-1 inhibitors, PD-L1 inhibitors and CTLA-4 inhibitors, which have demonstrated promising outcomes in clinical trials for some cancers. Nevertheless, not all types of malignancies are suitable for treatment with ICIs. We further analyzed BMI1 gene expression regarding the three types of ICIs and found that BMI1 exhibited significant resistance towards PD-L1 inhibitors compared with other agents (Suppl. Fig. 6A-C). Higher expression levels were observed in PD-1 or PD-L1 non-responder groups. However, only within the PD-L1 group was BMI1 a risk factor for immunotherapy. The molecular mechanism is clearly illustrated in Suppl. Fig. 6D, showing analysis of correlations between BMI1 and the immune checkpoints. Across pan-cancer groups, the expression of BMI1 exhibited a significant positive correlation with nearly all immune checkpoint markers, including CD274.
The TIDE analysis results are presented in Suppl. Fig. 7A. In melanoma (TCGA) and METABRIC, the expression of BMI1 showed a positive correlation with the T dysfunction value, while it exhibited a negative correlation in E-MTAB-179 and endometrial cancer (TCGA). Additionally, the cellular components are known to regulate cancer characteristics and can serve as potential targets for tumor therapy. BMI1 was found to be negatively correlated with immune scores in ACC, BLCA, BRCA, CESC, GBM, KIRC, LIHC, OV, PCPG, SARC SKCM, STAD, THCA, and UCEC (Suppl. Fig. 7B). Among all cancers analyzed collectively (pan-cancer), COAD, KIRC, and LGG were most strongly associated with BMI1. In COAD specifically, BMI1 expression demonstrated the strongest negative correlation with CD8+ T cell infiltration level (R = –0.393) and macrophage infiltration level (R = –0.395). However, such a clear positive correlation was observed in TGCT only (R = 0.264). Furthermore, we observed that BMI1 expression was negatively correlated with stromal scores in ACC (R = –0.236), BLCA (R = –0.125), GBM (R = –0.279), PCPG (R = –0.195), TGCT (R = –0.318), and UCEC (R = –0.089).
Enrichment analysis of BMI1
To identify genes recurrently co-expressed with BMI1 in cancer, the top 200 co-expressed genes in the 32 cancer types were extracted from the Spearman correlation analysis (Q < 0.05) in GEPIA. Combining the top 200 co-expressed genes for each cancer type, some genes occurred more than once. When duplicates were removed and BMI1 was included in the list, 6601 genes remained. The Metascape and Reactome Pathway Database were then used to identify signaling pathways associated with BMI1 and the co-expressed genes. In total, 57 pathways of KEGG and 376 pathways of Reactome were identified; among them, pathways playing a pivotal role in the cell cycle, DNA damage repair, and chromatin organization were found to be overrepresented (Suppl. Figs. 8, 9). GSEA was applied to identify signaling pathways involved in tumorigenesis of pan-cancer between low and high BMI1 expression in the KEGG databases (Suppl. Fig. 10A-K). It was obvious that significant differences existed in the enrichment of KEGG pathways in high BMI1 expression groups. Although in different types of tumors, it showed that pathways including ribosome, antigen processing and presentation, cytokine-cytokine receptor interaction, antigen processing and presentation and natural killer cell mediated cytotoxicity were significantly differentially inhibited in BMI1 high expression groups. The repeated occurrence of the above immune-related pathways in different types of tumors also confirmed once again that BMI1 plays an important role in TME and leads to patient resistance to tumor immunotherapy.
Discussion
We comprehensively investigated the role of PRC1 in pan-cancer by expression analysis, survival analysis, clinical analysis, stem cell analysis, TMB analysis, immune correlation analysis, pathway enrichment analysis, immunotherapy assessment, and drug sensitivity evaluation. Our findings unequivocally demonstrate that PRC1 exerts a pivotal biological function. Notably, BMI1 not only possesses well-established regulatory functions in tumor cell transcriptional control [19], DNA damage repair [20], and cell cycle regulation [21], but also exerts a dominant influence on the TME and affects sensitivity to chemotherapy and immunotherapy.
Multiple interaction mechanisms exist among the proteins within the PRC1 complex, which contribute to its formation and function [10]. Previous studies have substantiated the intimate interaction between BMI1 and Ring1A/Ring1B [22]. This RING finger domain plays a pivotal role in ubiquitin ligase activity, enabling BMI1 to bind ubiquitin proteins and subsequently attach them to histone proteins on chromatin. Conversely, the CBX proteins interacts with methylated histones through its chromodomain, thereby directing the localization of the PRC1 to these methylated histones [23]. PHC family proteins interact with CBX proteins to enhance the stability and functionality of PRC1 [24]. Therefore, the consistent overexpression of PRC1 tends to facilitate tumor development. In the TCGA and GTX datasets, our findings revealed that all members of the PRC1 complex exhibited higher abundance in CHOL, COAD, ESCA, LIHC, and STAD, which heightened activation of PRC1 function in these types of tumors.
The impact of the PRC1 complex on prognosis and progression was assessed using Cox univariate analysis, and staging analysis. Four clinical prognostic indices were evaluated in both TCGA and GEO databases. Only consistent conclusions were considered as reliable statistical results. Taking COAD as an example, BMI1 was identified as a significant prognostic factor for OS and DSS. Additionally, RNF2 and PHC3 emerged as risk factors for CRC patients. Moreover, CBX2 was found to be a significant predictor of OS in patients with BRCA, LUAD, and SKCM tumors. Furthermore, staging analysis revealed that except for L3MBTL2 and PHC1, the abundance of PRC1 members increased progressively during COAD progression. The differential expression, prognostic, and clinical characteristics collectively support the notion that PRC1 serves as a risk factor for COAD.
Cancer stem cells (CSCs) are a distinct subset of tumor cells that possess stem cell-like characteristics, including the ability to self-renew, exhibit pluripotency, and initiate tumor regeneration [25]. CSCs play a pivotal role in cancer progression by perpetuating tumor growth through continuous generation of new malignant cells [26]. Furthermore, they demonstrate remarkable resistance to conventional therapeutic modalities such as radiotherapy and chemotherapy due to their activation of various cellular escape mechanisms, including augmented DNA repair pathways and enhanced antioxidant defenses [27]. They possess enhanced migratory and invasive capabilities, while exhibiting reduced immunogenicity, thereby evading immune surveillance and attack, subsequently disseminating to distant sites in vivo for the establishment of metastatic tumors [27]. We employed the OCLR method to compute RNAss scores and DNAss scores, which serve as stemness indicators for both tumor samples, and subsequently correlated them with the expression levels of PRC1 members. BMI1 has been extensively investigated in the context of CSCs due to its pivotal role in maintaining self-renewal, proliferation, and treatment resistance. A positive correlation between BMI1 and DNAss was observed in pan-cancer. Meanwhile, we also observed a remarkable consistency of two independent drug sensitivity datasets regarding chemotherapy resistance, thereby suggesting a pivotal role played by the PRC1 complex.
To investigate the impact of PRC1 in immunotherapy, we conducted cross validation using the ROC Plotter and Kaplan-Meier Plotter databases. In the ROC Plotter, we observed higher expression of BMI1, PHC2, and RING1 between the immunotherapy-sensitive and -insensitive patients. As for the immunotherapy response, BMI1, PHC2, RING1, and RNF2 were found to be upregulated in the resistant patients. In the Kaplan-Meier Plotter, all PRC1 members showed statistical significance regarding patient prognosis after immunotherapy. However, only higher expression levels of BMI1, PHC1, PHC3, and RNF2 were negatively correlated with patient prognosis. By combining both outcomes, we elucidated that BMI1 served as a robust biomarker for the implementation of immunotherapeutic strategies. Furthermore, we observed that elevated BMI1 exhibited an inhibitory effect on PD-L1 therapy.
To elucidate the underlying mechanisms behind the inhibitory effect of BMI1, we conducted further mechanistic investigations. The tumor microenvironment (TME) is a complex ecosystem, which collectively shapes the behavior and properties of the tumor [28]. Here, we observed a significant negative correlation between most types of immune cells and BMI1 in pan-cancer. The CD56dim subset exhibited the most significant negative correlation with BMI1 among all immune cell populations. Interestingly, the expression levels of most immune checkpoints, particularly CD274 and CTLA4 genes, exhibited a positive correlation with BMI1. However, these results are consistent with the effect of BMI1 on immunotherapy. Strikingly, the GSEA analysis also revealed that BMI1 may be implicated in immune responses, as evidenced by the significant inhibition of immune-related functions and signaling pathways such as natural killer cell mediated cytotoxicity and cytokine receptor interaction. Our findings provide insights into the expression profile, prognostic value, and the sensitivity of chemotherapy and immunotherapy of PRC1. However, experimental and animal investigations are warranted to further elucidate the findings of our study.
Conclusions
In this study, we conducted a comprehensive multi-omics investigation of the PRC1 complex in pan-cancer, elucidating its precise role and function in tumorigenesis. Furthermore, we revealed the detrimental impact of BMI1 on immunotherapy and identified it as a potential target for immunotherapeutic interventions. These findings highlight the promising potential of targeting BMI1 as an innovative approach to tumor immunotherapy.