
Introduction
Acute gouty arthritis (AGA) is one of the most common inflammatory diseases, with severe pain and swelling, and significantly impairs daily activities [1, 2]. AGA caused by the deposition of monosodium urate (MSU) and a classic attack affects the first metatarsophalangeal, ankle, and foot joints. MSU crystals accumulate in joints and surrounding tissues, stimulating the synovium and producing pathological reactions. Deposited MSU crystals can lead to inflammatory responses in human macrophages, particularly changes in pro-inflammatory factors, which play an important role in the pathogenesis of acute gout [3]. Previous investigations have shown that the prevalence of AGA ranges from 1% to 2% in adults, and its prevalence and incidence show no signs of declining [3, 4]. Clinically, one or more oral anti-inflammation medicines (i.e., nonsteroidal anti-inflammatory drugs, colchicine, corticosteroids) are commonly used to control and manage symptoms [5]. However, the common treatments show various side effects and require over 12-24 hours, or even several days, to achieve therapeutic efficacy [6]. Safe and effective options to treat acute gout attacks are still needed.
Long non-coding RNAs (lncRNAs) are greater than 200 bp in length. lncRNAs play an essential role in a variety of biological functions rather than being “redundant”. Indeed, lncRNAs can impact transcriptional and post-transcriptional regulation by enhancer-promoter looping, mRNA splicing, mRNA editing, protein translation, and protein modification [7, 8]. They have even been used as molecular markers for several of diseases [9]. lnc-RNAs participate in the inflammatory responses of human pathological processes. Growth arrest-specific transcript 5 (GAS5) has been shown to play an essential role in autoimmune diseases. The abundance of GAS5 decreased in CD4 T cells and B cells of rheumatoid arthritis (RA) and systemic lupus erythematosus (SLE) patients [10]. Additionally, it has been reported that GAS5 is downregulated in RA synovial tissues [11]. Conversely, another study found that T cells of RA patients showed increased expression of GAS5 [12]. These studies reveal inconsistencies in GAS5 expression. Furthermore, a study showed that GAS5 deficiency leads to higher serum levels of uric acid [10], a key risk for gout, which has attracted our attention. We have not found any previous study on GAS5 expression or function in AGA.
MicroRNA (miRNAs) have also been determined as short noncoding RNA molecules composed of approximately 23 nt [11]. The majority of studies have confirmed that miRNAs play pivotal roles in physiological status, such as proliferation, differentiation, inflammatory response, and signaling pathways [9, 11-13]. Moreover, research on competing endogenous RNA (ceRNA) is on the rise. Evidence suggests that lncRNAs can act as a “sponge” through competitive binding of miRNAs to modulate gene expression in arthritis [14, 15]. A growing body of evidence is available to suggest that miR-485-5p could serve as a target gene of lncRNA and has been linked to the inflammatory process of arthritis [16-18]. In previous publications, miR-485-5p expression was altered in the inflammatory process of arthritis [17, 18].
Herein, we assayed the changes of GAS5 and miR-485-5p in AGA subjects’ serum. Then, we confirmed the impact of GAS5 on inflammation in the cell model and the association between GAS5 and miR-485-5p in AGA. We speculated that expression of GAS5 is suppressed in AGA and GAS5 can act through sponging miR-485-5p. This work provides a new viewpoint at the transcriptome level and explores potential biomarkers for the treatment of AGA.
Material and methods
Biological samples
The study group included 150 male patients with AGA who were admitted to Qinhuangdao Hospital of Integrated Traditional Chinese and Western Medicine between 2020 and 2023 and met the inclusion criteria. At the time of their initial AGA diagnosis, peripheral blood was collected and clotted, and serum was obtained from a centrifuge at low temperature. Meanwhile, 145 cases of relatively normal blood uric acid were selected as the healthy control group (HC). Serum biochemical parameters, including C-reactive protein (CRP), uric acid (UA), sedimentation (ESR), lymphocytes, and monocytes, were measured in all patients using a fully automated serum biochemistry analysis. The general clinical and laboratory data of the AGA and HC groups are shown in Table 1.
Table 1
Clinical and laboratory characteristics of subjects
Acute gouty arthritis patients met the following criteria: 1) first-time diagnosis in the Rheumatology Department and episodes < 48 hours, 2) 2015 ACR/EULAR Gout classification criteria as a reference, 3) patients aged between 18 and 70 years, 4) no history of medication, 5) no hypertension, diabetes, cerebral infarction, immune system disease, hematologic disease, malignancies, or other types of arthritis. The approval of the ethics committee was granted by the Qinhuangdao Hospital of Integrated Traditional Chinese and Western Medicine. All of the subjects provided signed consent.
Cell culture and stimulation
The human monocytic cell line (THP-1) was purchased (BNCC358410, BeNa). The cell line was cultured in RPMI 1640 medium (HyClone), containing 10% fetal bovine serum (Gibco) and 1% penicillin-streptomycin (Solarbio) under conditions of 5% CO2 and 37oC. The macrophages were obtained from THP-1 monocytes using 100 ng/ml phorbol-12-myristate-13acetate (PMA, Sigma-Aldrich) for 24 h. According to previous studies of the AGA model in vitro [26, 27], THP-1 macrophages (1 × 10⁶ cells/well in 6-well plate) were stimulated with MSU crystals (InvivoGen) at 250 µg/ml for 24 h.
Cell transfection
THP-1 cells (5 × 10⁴ cells/well) were seeded into 6-well plates and differentiated with PMA for 24 h. mimic NC, miR-485-5p mimic, inhibitor NC, and miR-485-5p mimic inhibitor were purchased from RiboBio (Guangzhou, China). pcDNA3.1-NC and pcDNA3.1-GAS5 were purchased from GenePharma (Shanghai, China). Transfection was performed using Lipofectamine 2000 (Invitrogen) at 0.5 µg/ml for 48 h. The RNA sequences for transfection are presented in Table 2.
Table 2
Sequences of primers in RT-qPCR
RNA extraction and quantitation
Total RNA was obtained using TRIzol reagent (Invitrogen). The concentration and purity of total RNA were tested. The PrimeScript RT reagent kit (RR037, Takara)/Mir-X miRNA First Strand Synthesis Kit (638315, Takara) was used for the reverse transcription. PCR amplification reactions were performed with SYBR Premix Ex Taq kit (RR047A, Takara). GAPDH or U6 was used as an internal reference for lncRNA and miRNA, respectively. The 2-ΔΔCt method was used to quantify the relative expression level. Each assay was repeated in triplicate. Primer sequences are presented in Table 2.
Enzyme-linked immunosorbent assay (ELISA)
According to the manufacturer’s procedure, the levels of IL-1β (E-EL-H0149c), IL-8 (E-EL-H6008), and TNF-α (E-EL-H0109c) in the serum and cell supernatant were measured with commercial ELISA kits (Elabscience, Wuhan, China).
Bioinformatics analysis and dual-luciferase reporter assay
To predict the potential binding site, bioinformatic databases (StarBase and ENCORE) were used. Wild type and mutant reporter gene fragments of GAS5 (GAS5-WT, GAS5-MUT) were synthesized by RiboBio (Guangzhou, China). Afterward, these plasmids were transfected into THP-1 macrophages using Lipofectamine 2000. The relative luciferase activity was detected using the luciferase reporter assay system (Promega) 48 h after transfection.
Cytoplasmic/nuclear RNA isolation experiment
The PARIS kit (AM1921, Invitrogen) was employed to extract and isolate RNA. THP-1 cells were seeded and collected according to the manufacturer’s protocol. RT-qPCR was performed to detect cytoplasmic and nuclear GAS5 expression, and GAPDH and U6 were used as the cytoplasmic and nuclear reference, respectively.
Statistical analysis
Experimental assays were conducted at least 3 times and presented as mean ± SD. SPSS software (version 23.0) and GraphPad Prism 9 were employed for statistical analyses. Unpaired Student’s t-test or one-way ANOVA was utilized. The diagnostic performance was analyzed using ROC curves. Pearson correlation was assessed the relationship. Results with p < 0.05 were significant (*p < 0.05, **p < 0.01, ***p < 0.0001).
Results
Basic clinical information
The mean uric acid (594.87 ±114.80 vs. 336.21 ±49.80, p < 0.0001), mean CRP (594.87 ±114.80 vs. 336.21 ±49.80, p < 0.0001), and ESR (13.56 ±4.38 vs. 3.12 ±1.05, p < 0.0001) were higher than in the healthy volunteers. Lymphocytes (1.88 ±0.33 vs. 2.73 ±1.09, p < 0.0001) and monocytes (0.57 ±0.21 vs. 0.70 ±0.29, p < 0.0001) were much lower than those of healthy volunteers (Table 1).
GAS5 is downregulated in the serum of AGA
To identify the change in GAS5 expression associated with AGA, the GAS5 concentration was detected in the serum of all subjects (Fig. 1A). The qRT-PCR results demonstrated that, compared with HC subjects, GAS5 expression was significantly lower in AGA patients (p < 0.001). The ROC curve comparing HC to AGA patients presented an AUC value of 0.915 (95% CI: 0.880-0.950), with a specificity of 0.834 and a sensitivity of 0.927, indicating a superior ability to distinguish between the two groups (Fig. 1B). Furthermore, Pearson’s correlation indicated that GAS5 was correlated with the clinical features in AGA subjects. As shown in Table 3, uric acid was strongly negatively associated with GAS5, and other features such as ESR, lymphocytes, monocytes, CRP, and VAS score were also related to GAS5. This result indicated that the reduction of GAS5 expression was closely associated with AGA.
Fig. 1
Expression and ROC curve assessment of GAS5 in subjects. A) GAS5 expression of serum in HC (n = 145) and AGA patients (n = 150) was quantified using RT-qPCR. B) Visualizing the discriminatory capability of GAS5 for AGA using ROC curve. ***p < 0.001 vs. HC. HC – healthy control, AGA – acute gouty arthritis, ROC – receiver operating characteristic

Table 3
Pearson correlation values between GAS5 and clinical characters in AGA patients
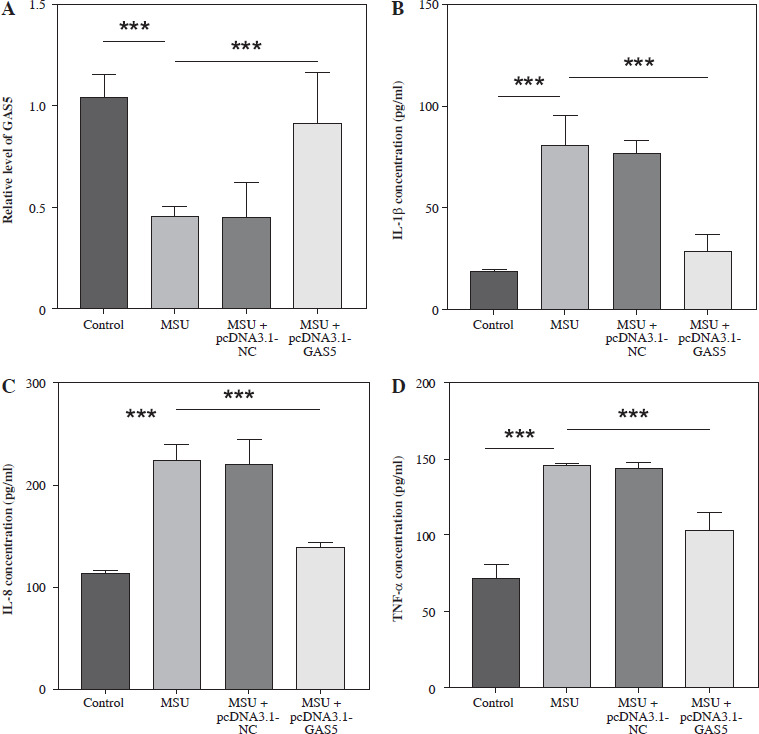
GAS5 suppressed inflammation in THP-1 macrophages in vitro
To explore the function of GAS5 in AGA, the cell model of THP-1 induced by 250 µg/ml (based on previous experience) MSU was established. The result illustrated that the GAS5 levels significantly decreased after MSU treatment (p < 0.001, Fig. 2A). Then, the GAS5 overexpression plasmids were used for further experiments. The results demonstrated that the GAS5 expression was obviously upregulated in the MSU + pcDNA3.1-GAS5 group compared with the only MSU-induced group (p < 0.001, Fig. 2A). Additionally, IL-1β, IL-8, and TNF-α were significantly increased following MSU treatment, which was markedly reversed by transfection with pcDNA3.1-GAS5 (p < 0.001, Fig. 2B-D).
Fig. 2
Effect of interfering with GAS5 levels in THP-1 macrophages on the release of pro-inflammatory cytokines. A) GAS5 level after MSU treatment and transfection with pcDNA-GAS5 was quantified using RT-qPCR. IL-1β (B), IL-8 (C), and TNF-α (D) were detected using ELISA in MSU-induced and overexpressed GAS5 THP-1 macrophages respectively. Values represent mean ± SD (n = 3 per group). ***p < 0.001 vs. control or MSU. MSU – monosodium urate
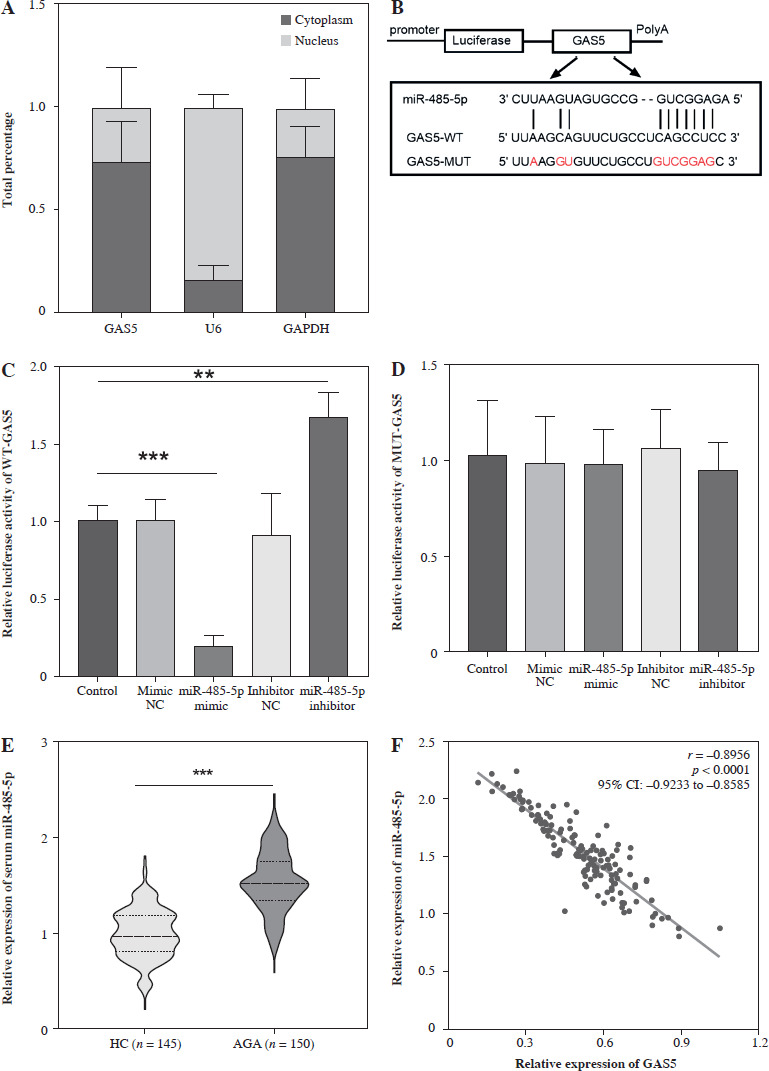
miR-485-5p served as the target of GAS5
We next explored the specific mechanism by which GAS5 regulates AGA. GAS5 was located in the cytoplasm and nucleus of THP-1 macrophages, mainly in the cytoplasm (Fig. 3A). Then we identified that there were putative binding sites between the GAS5 and miR-485-5p which act as a predicted target of GAS5 through bioinformatics (Fig. 3B), which was also confirmed by relative luciferase activity. The luciferase activity of WT-GAS5 3′UTR was dramatically changed after miR-485-5p mimic and inhibitor treatment (p < 0.001, p < 0.01, Fig. 3C), while that of MUT-GAS5 showed no significant difference (Fig. 3D). Next, all of the subjects’ miR-485-5p expression was detected. According to the results, miR-485-5p was notably increased in the AGA group (p < 0.001, Fig. 3E). Pearson’s correlation revealed that miR-485-5p was highly negatively associated with GAS5 expression (r = –0.8956, p < 0.0001, Fig. 3F). These results suggested that GAS5 may act as a miR-485-5p sponge.
Fig. 3
miR-485-5p was a target miRNA of GAS5. A) Analysis of GAS5 subcellular localization in THP-1 macrophages. B) Bioinformatics predicted that GAS5 has putative binding sites to miR485-5p. C, D) Dual-luciferase reporter assay luciferase activity of miR-485-5p target gene. E) miR-485-5p expression of in HC (n = 145) and AGA patients (n = 150) serum was quantified using RT-qPCR. F) The relationship between miR-485-5p and GAS5 was evaluated by Pearson’s correlation in AGA patients (n = 150). Values represent mean ± SD (n = 3 per group). **p < 0.01, ***p < 0.001 vs. HC or control HC – healthy control AGA – acute gouty arthritis
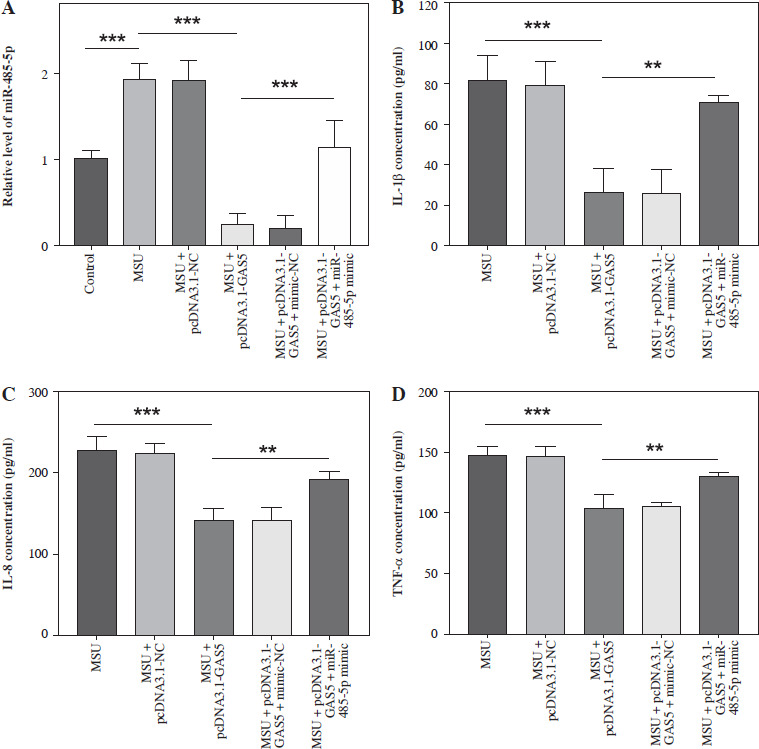
Following transfection, the target miR-485-5p expression was evaluated. MSU treatment notably enhanced the miR-485-5p level, which then decreased after pc-DNA3.1-GAS5, while the reduction was reserved by miR-485-5p mimic treatment (p < 0.05, Fig. 4A). In addition, IL-1β, IL-8, and TNF-α were measured through ELISA. All of them showed a significant reduction after overexpressing GAS5 compared to MSU (p < 0.001), while this tendency was suppressed by miR-485-5p mimic (p < 0.01, Fig. 4B-D).
Fig. 4
GAS5 impacts the expression of pro-inflammatory cytokines in THP-1 macrophages by modulating miR-485-5p. A) RT-qPCR was employed to analyze the expression of miR-485-5p in THP-1 macrophages after overexpression of GAS5 and transfection with miR-485-5p mimic. The effect of the miR-485-5p mimic and overexpression of GAS5 on IL-1β (B). IL-8 (C) and TNF-α (D) were evaluated using ELISA. Values represent mean ± SD (n = 3 per group). **p < 0.01, ***p < 0.001 vs. control, MSU, or MSU + pcDNA3.1-GAS5. MSU – monosodium urate
Discussion
Acute gouty arthritis is a prevalent type of metabolic disease due to overproduction and underexcretion of uric acid. It is caused by the deposition of MSU crystals in the joints and surrounding tissues and induces inflammatory responses [19]. Although MSU has been observed for a long time, the mechanisms by which MSU causes an inflammatory cytokine storm are still being explored [20]. IL-1β has been found to play a key role in the occurrence and development of AGA. As a pro-inflammatory factor, mature IL-1β has the ability to recruit and modulate neutrophils to the sites of infection, and IL-1β signaling is confirmed as an initiatory event that triggers the inflammatory response [21]. MSU has been found to stimulate the expression of TNF-α in synovial cells [22]. In synovial fluid, the presence of IL-8 is associated with neutrophil recruitment. IL-8 is released by synovial cells, and may influence neutrophil recruitment. Various cytokines can drive synovial cells to synthesize IL-8 such as TNF-α [23]. The absence of detection of pro-inflammatory cytokines in the included samples of this study is a limitation. However, increased levels of pro-inflammatory cytokines in acute gouty arthritis have been verified in the literature [26]. Additionally, the upregulation of inflammatory-related factor levels in the MSU-induced cell model has also been confirmed [24, 25]. Consistent with this, the enhancement of pro-inflammatory cytokines in an in vitro model, including IL-1β, IL-8, and TNF-α, was observed in our study.
Severe pain is a common symptom caused by AGA. Since no effective and safe therapies for AGA have been established yet [19], it is important to find new potential targets to relieve AGA. GAS5 is involved in the development of various diseases including cardiac fibrosis, osteoporosis, and coronary atherosclerosis [26-28]. Taking into account the fact that an increased urate level has been proven to play a considerable role in the development of gout [29], we speculated that GAS5 is involved in the process of AGA. This is supported by the result of Pearson’s correlation between GAS5 and clinical characteristics, especially the content of uric acid in serum. In addition, previous studies have verified that GAS5 acts as a regulator in nonalcoholic fatty liver, sepsis-associated renal injury, and myocardial infarction [30-32]. Considering that the same lncRNA may behave differently in different diseases, the activity of GAS5 in AGA remains vague. Our results show that GAS5 was downregulated in the serum of the AGA group, suggesting the potential roles of GAS5 in AGA. Next, we established the AGA cell model by exposing the THP-1 macrophages to MSU and observed the release of pro-inflammation cytokines including IL-1β, IL-8, and TNF-α, accompanied by a reduction of GAS5 expression. Conversely, GAS5 overexpression reduced expression of IL-1β, IL-8, and TNF-α in our cell model after pcDNA3.1-GAS5 transfection. Furthermore, ROC curve analysis indicated that GAS5 has high diagnostic value for AGA. Combined with the expression levels, we hypothesize that GAS5 may be a biomarker for AGA based on our subjects. It has been reported that, functionally, GAS5 suppresses proliferation and migration and promotes apoptosis in RA fibroblast-like synoviocytes [11]. However, this study focused only on the alteration of certain inflammatory cytokines, lacking the detection of related cellular activities such as cell proliferation and apoptosis. Further exploration of these cellular activities is needed to provide mechanistic insights into AGA. Furthermore, patients included in this study often received conventional treatment, so we ignored the influence of drugs on GAS5 expression. However, this is an interesting clinical issue that warrants further investigation.
It is widely known that lncRNAs could impact mRNA expression by sponging miRNAs. In the past decades, a large number of miRNAs have been recognized, and recent studies have indicated that miRNAs are involved in immune cell development and function [33]. Studies identified that miRNAs could participate in the process of arthritis as an inflammatory regulator [34-36]. In rheumatoid arthritis, the protective role of GAS5 has been confirmed, and some studies have explored its downstream targets, such as miR-222-3p, miR-128-3p, and miR-361-5p [37-39]. However, given the complexity of the gene expression regulatory network and the absence of studies proposing a clear regulatory axis between GAS5 and its downstream targets, these potential targets remain worth investigating. We used the bioinformatic method to predict the potential targeting relationship of GAS5 and found something new. In this study, a negative association between GAS5 and miR-485-5p expression was found in correlation analysis, which means that the expression of miR-485-5p was opposite to GAS5. Subsequently, a dual-luciferase reporter assay further suggested that GAS5 was closely connected with miR-485-5p in THP-1 macrophages. Evidence regarding the relationship between miR-485-5p and inflammatory diseases has been provided by several studies [15, 18, 40]. In the current research, miR-485-5p was closely associated with the inflammatory response via the alteration of pro-inflammatory factors. Furthermore, the regulatory axis of GAS5/miR-485-5p was confirmed through the MSU-induced TPH-1 cell model. We observed that overexpression of GAS5 relieved cytokines IL-1β, IL-8, and TNF-α. Nevertheless, the defensive consequence of GAS5 was reversed by miR-45-5p mimic. This result indicated that GAS5 regulates inflammatory responses by targeting miR-485-5p.
There are some limitations in this study. The small sample size and the lack of animal models in vivo limit the completeness of the experiments. Additionally, the absence of detection of pro-inflammation cytokines in the included samples and related cellular activities in the cell model were also potential limitations. Future research should include animal experiments, a larger sample size, and assessments of cellular activities to reveal more comprehensive details of mechanisms and further clinical insights.
In conclusion, our study demonstrated that GAS5 is downregulated in AGA serum and suppresses the inflammatory cytokine activity of THP-1 macrophages by sponging miR-485-5p. GAS5 is a potential novel diagnostic and clinical target for AGA treatment.