
Introduction
Immunologic rejection poses a significant challenge in allograft transplantation. Mature dendritic cells (mDCs), which elicit immune responses, are implicated in potent immunologic rejection processes. Consequently, the preservation of immunological tolerance within dendritic cells (DCs) assumes paramount importance in the context of organ transplantation. Tolerogenic DCs, characterized by an immature phenotype and limited effector T cell stimulation capacity, hold promise in inducing regulatory T-cells (Tregs) and mitigating rejection [1, 2]. In vivo studies demonstrated that immature dendritic cells (imDCs), sourced from the donor or recipient, laden with donor-specific antigens, could induce immune tolerance, enhancing post-transplant survival of the organ [3, 4]. Accumulated evidence showed that imDCs or gene-modified DCs could induce immunological tolerance [5], thereby enhancing the success rates of organ transplantation, including kidneys, livers, and hearts [6-8]. However, the imDCs are susceptible to maturation, especially in inflammatory environments, risking rejection [9]. Therefore, understanding the molecular mechanism driving imDCs to mDC transition and maintaining tolerogenicity is crucial for transplantation success.
Numerous molecules have been identified to play pivotal roles in the differentiation, maturation, and functionality of DCs [10]. MicroRNAs (miRNAs), a class of crucial cellular regulators, have the capacity to modulate gene expression, thereby influencing cellular fate and function [11, 12]. Several miRNAs, including miR-146a, miR-132, and miR-155, have been linked to DC development and function [13]. Notably, miR-155 is closely related to cellular immune function and plays a significant regulatory role in processes such as dendritic cell, B cell, and T cell activation. miR-155 is expressed in activated B cells, T cells, and macrophages [14]. For instance, Thai et al. found that in a miR-155 knockout mouse model, T cells shifted toward a Th2 phenotype, and Th2 cytokine expression increased [15]. Upregulation of miR-155 also appears to be a decisive feature of DC maturation: increased miR-155 expression was observed in multiple subsets of mouse and human DCs in response to various TLR ligands, interferon α (IFN-α), and tumor necrosis factor α (TNF-α) [16, 17]. Remarkably, the degree of change in miR-155 expression during DC maturation is substantial, with a remarkable increase ranging from 50- to 130-fold in lipopolysaccharide (LPS)-treated DCs [18]. Importantly, miR-155 not only serves as a hallmark of DC maturation but also emerges as a critical determinant of mDC functionality. mDCs deficient in miR-155 exhibit an impaired ability to effectively activate T cells [19]. Despite the role of miR-155 in the immune response to various diseases, the function of miR-155 in monkey DCs remains elusive.
In this study, we aimed to: 1) develop imDCanti-155 to assess miR-155’s impact on DC maturation and apoptosis; 2) investigate the effect of imDCanti-155 on the differentiation of T cell subsets in a rhesus monkey immune tolerance model and in vitro T cell co-culture model; and 3) elucidate the mechanism underlying imDCanti-155 action.
Material and methods
Animals
Rhesus monkeys were purchased from the Experimental Animal Center of Kunming Institute of Zoology, Chinese Academy of Sciences (production license number: SCXK (Dian) K2013-0012; quality certificate: yes; breeding method: long-term breeding in Huahongdong Park, Kunming Institute of Zoology, Chinese Academy of Sciences). The monkey farm is especially administered by the animal center, and the animals are raised in single cages. The raising method is conventional. The animal experiments were approved by the ethics committee following review by the Institutional Animal Care and Use Committee of Kunming Institute of Zoology, Chinese Academy of Sciences (IACUC number: IACUC20034). The animal outcome was rehabilitation treatment, as the animal experiment was a small survival operation and did not lead to the death of experimental animals.
Extraction and culture of imDCs from bone marrow
T cells and DCs were isolated from the bone marrow of rhesus monkeys and purified by magnetic bead-based cell sorting (Miltenyi Biotec, Bergisch Gladbach, Germany) following the protocol of the Zheng et al. study [20]. CD34+ cells then were separately cultured in RPMI 1640 medium (Thermo Fisher Technology Co., Ltd., Shanghai, China) containing 10% fetal bovine serum (Thermo Fisher Technology Co., Ltd., Shanghai, China) and 1% penicillin/streptomycin with 20 ng/ml GM-CSF (PeproTech) and 10 ng/ml IL-4 (PeproTech) at 37°C with 5% CO2. On day 6 of cell culture, the purified immature DCs were then plated at a density of 1 × 10⁶ cells/ml in six-well cell culture plates and infected with anti-miR-155 lentivirus (sequence: ACCCCTATCACGATTAGCATTAA), negative control, or SOCS1 short interfering RNA (siRNA) (50 nmol/l; GenePharma, China) at a multiplicity of infection (MOI) of 1 : 300 for 48 h in serum-free RPMI 1640. mDCs were generated by stimulating imDCs with lipopolysaccharide (LPS; 100 ng/ml; Sigma) for 48 h to induce maturation. The morphological characteristics of the cells were observed by light microscopy. On the 9th day of culture, the cells were collected to observe their ultrastructure by electron microscopy, and the cellular immune phenotype and apoptosis were identified by flow cytometry.
Flow cytometry analysis for phenotypic identification of DCs and Tregs
For DCs, the DC suspensions of each group were collected and centrifuged at 1800 rpm for 5 min at room temperature. The supernatant was discarded, and the cells were washed twice with 150 µl of phosphate-buffered saline (PBS). The cell concentration was adjusted to 5 × 10⁵/ml. Then, 0.5 µl each of PE-labeled monoclonal anti-bodies CD80, CD83, CD1a, and MHC-II (BD Pharmingen, MA, USA) and the isotype control were added, mixed well, and incubated in a refrigerator at 4°C in the dark for 20 min.
For Tregs, cells were stained with FITC-anti-CD4 and PerCP-Cy5.5-anti-CD25, followed by APC-anti-Foxp3 staining buffer (all from eBioscience) according to the manufacturer’s instructions. The stained cells were analyzed using the FACSCanto II system (BD Biosciences), and the data were analyzed using FlowJo software.
Apoptosis assays
Cells were harvested at the indicated time points, washed, labeled with Annexin V for 30 minutes on ice, and subsequently stained with 7-AAD. Annexin V/7-AAD staining was analyzed by flow cytometry. Sub-G0 analysis of cell apoptosis was also used. Briefly, cells were washed with 1 mM PBS and fixed with 90% ethanol for at least 30 minutes at –20°C. The cells were then washed, and cellular DNA was stained with RNase (50 µg/ml, Sigma- Aldrich) and 7-AAD (10 µg/ml) for 45 minutes at room temperature. Fluorescence intensity was quantified by flow cytometry.
ELISA assay
The contents of interleukin (IL)-2, IL-4, IL-10, and interferon γ (IFN-γ) in the cell supernatant and serum were detected according to the instructions of the ELISA kit (NeoBioscience, China). A standard curve was drawn through the standard, and then the contents of IL-2, IL-4, IL-10, and IFN-γ in the sample were calculated according to the OD value of the sample.
Mixed lymphocyte reaction (MLR) assay
DCanti-NC and DCanti-155 were stimulated with LPS for 48 h, incubated with mitomycin C for 2 h at 37°C, and washed three times with PBS. 15 ml of peripheral blood T cells, harvested from rhesus monkeys, were inoculated per well in a 12-well plate, and IL-2 and RPMI 1640 medium containing 10% FBS were added for complete culture. The pretreated DCs were co-cultured with 5 × 10⁵ T cells in 96-well culture plates at ratios of 1 : 1, 1 : 10, 1 : 20, 1 : 50, and 1 : 100 for 72 h. Untreated T cells and RPMI-1640 with 10% FBS culture medium served as negative and blank controls, respectively. Then, these co-cultures were incubated with 10 µM BrdU for 24 h, and the proliferation of T cells was assessed using BrdU ELISA according to the manufacturer’s instructions (Dojindo Laboratories, Japan). All proliferation assays were performed in triplicate.
Immunofluorescence assay
The cells were washed, collected, and fixed using 4% paraformaldehyde for 15 min, and addressed with 0.5%Triton X-100 in PBS for 20 min. T cells were incubated with normal goat serum for 30 min, primary antibodies including anti-SOCS1 antibody (Abcam, Cambridge, MA, USA) overnight at 4oC, and diluted fluorescent secondary antibody at 37oC for 1 h. After incubation with 4°C, 6-diamidino-2-phenylindole (DAPI) in the dark for 5 min, the images were observed and collected under a confocal laser-scanning microscope (Fluo View v5.0 FV300; Olympus, Tokyo, Japan).
Quantitative RT-PCR
Total RNA was extracted using TRIzol reagent (Qiagen, Valencia, CA, USA), reverse transcribed into cDNA, and amplified using SYBR premix Ex Taq II (Takara, Dalian, China). Reverse transcription reactions were carried out at 16°C for 30 min, 42°C for 42 min, and 85°C for 5 min. The PCR protocol consisted of 40 cycles of 95°C for 10 s and 60°C for 1 min, followed by a heat denaturation protocol. U6 was used as an endogenous control for miR-155 detection and β-actin was used for mRNA. The 2-ΔCt method was used for calculation. The primer sequences used for RT-PCR are shown in Supplementary Table 1.
Western blot
Total protein from tissues and cells was extracted using RIPA lysis buffer (Beyotime Corporation, China). The protein concentration was measured with a BCA assay kit (Beyotime Corporation, China). Equal quantities of protein samples were denatured and separated using 8-12% SDS-PAGE, then were transferred to the PVDF membrane (4°C, 200 mA, 2 h). The membrane was blocked with 5% skimmed milk powder or BSA for 1 h at room temperature, then incubated with the diluted primary antibodies (all from Abcam, Cambridge, MA, USA) at 4°C overnight. After being washed with PBS, the membranes were incubated with appropriate secondary at room temperature for 1 h. The bands were imaged using ECL color development, and a gel imaging system was used for imaging analysis. For the semiquantitative determination of expression levels, ImageJ was used for the analysis of band gray values.
Allogeneic transplantation experiment
Donor skin preparation
The experiment involved allogeneic transplantation. Six rhesus monkeys (male, age 8-10 years, weight 9-12 kg) with the same O blood type and Rh factor results were used. Every two rhesus monkeys were randomly divided into donor and recipient. Three places were selected on the back of each monkey as the donor and recipient, and skin grafts were taken from the site. On the day of transplantation, the 3th day and the 6th day after the operation, the cells were induced, cultured, transfected, and collected in the laboratory in advance by subcutaneous injection at the transplantation site. The transplanted skin was finally divided into three groups, with 6 samples in each group: the control group, the imDCanti-NC group, and the imDCanti-155 group. Rhesus monkeys were injected with thiopental sodium (60 mg/kg) via intramuscular injection. After anesthesia, the monkeys were positioned in a prone position and the transplant area was marked with lines. The area was then sterilized with routine disinfection and draped with towels. A mixture of 5% lidocaine hydrochloride and normal saline was pre-mixed and used to perform local anesthesia for swelling in the transplant area. Using a surgical scalpel, the skin was incised along the marked lines, with a diameter of approximately 3 cm. Subcutaneous fat and hair were trimmed to create a moderately thick skin graft, which was rinsed with physiological saline and soaked in normal saline for later use. The time of skin harvesting was recorded for calculating the ischemic time before transplantation.
Skin grafting and behavioral observation
The prepared skin graft was applied to the wound area and secured with 4-0 sutures to fully stop bleeding. After suturing was completed, the wound was coated with gentian violet. Long suture ends were left in place and covered with Vaseline gauze to protect the skin graft, and moderate pressure was applied with elastic bandages to fix the graft on the trunk. During surgery, 50 ml of physiological saline and 1 g of cefuroxime injection were administered to prevent infection. After the surgery, different treatment groups received imDC suspension (1 × 10⁶/ml•kg) either under the skin graft or intravenously, according to their respective groupings. The rhesus monkeys were then kept in separate cages for feeding. Clinical rejection was scored based on a previously published scoring system for Vascularized Composite Allotransplantation (VCA) [21]. On the 7th day after transplantation, 1/2 of the skin grafts of each transplantation site were removed for testing.
Hematoxylin and eosin (H&E) staining
The skin tissue in each group was first fixed in 4% paraformaldehyde. Then, the tissues were treated with xylene and dehydrated using 100%, 95%, 90%, 80%, and 70% ethyl alcohol. After embedding in paraffin, the tissues were continuously cut into slices (about 4 µm). After dewaxing and hydration, the slices were processed with Harris hematoxylin (5 min), 1% hydrochloric acid alcohol (5 s), and 0.6% ammonia and eosin (2 min). After dehydration and transparency, the inflammatory infiltration was evaluated with a light microscope (DM6000B, Leica, Germany). Hematoxylin and eosin staining was assessed by the Banff 2007 Working Classification of Skin-Containing Composite Tissue Allograft Pathology [22].
Immunohistochemistry (IHC) assay
The slices were prepared using xylene I, xylene II, 95%, 90%, 80%, and 70% ethyl alcohol, followed by distilled water. Then, the slices were treated with 3% hydrogen peroxide and ethylenediamine tetraacetic acid (EDTA). Subsequently, the slices were blocked and treated with anti-SOCS1 (1 : 200; Abcam, Cambridge, MA, USA) at 37oC for 1 h and a secondary antibody at 37oC for 30 min. After processing with 3,3′-diaminobenzidine (DAB), the slices were stained with hematoxylin, 0.1% hydrochloric acid. Five microscopic fields in each section were examined under a microscope at the original magnification of ×100 (DM6000B, Leica, Germany).
Statistical analysis
GraphPad Prism 9.0 (GraphPad Software Inc., San Diego, CA, USA) was used for statistical analysis. All values were expressed as mean ± SD. Statistical significance was determined by performing ANOVAs for multiple comparisons and Student’s t-test for two comparisons. Differences in animal survival (Kaplan-Meier survival curves) were analyzed with the log-rank test. P values < 0.05 were considered statistically significant.
Results
Upregulation of miR-155 during DC maturation
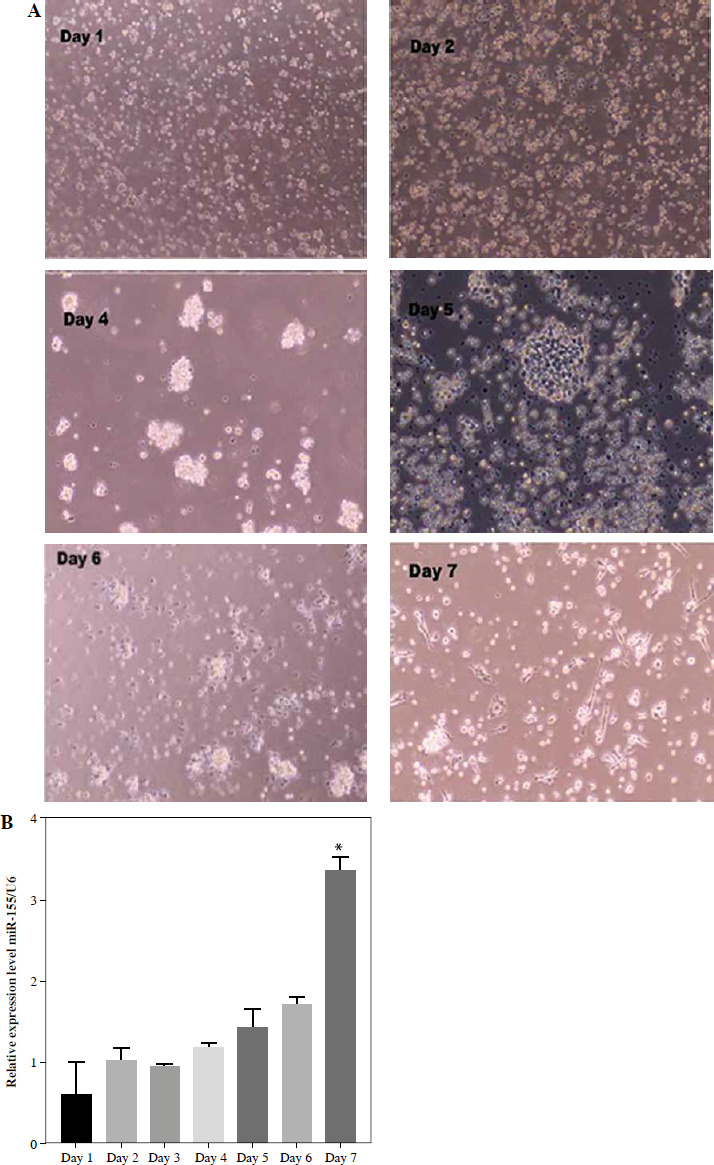
Upon culturing peripheral blood DCs from rhesus monkeys for 24 hours, the cells appeared isolated, exhibited a small volume phenotype, and formed few imDC clusters. After 48 hours of culture, most cells adhered to the wall, with some forming clusters and displaying varied sizes and morphologies. By the fourth day of culture, the cell clusters had enlarged, showing increased suspension growth and colony formation, accompanied by protrusions on some cells. Subsequently, by the fifth day, the cells gradually became suspended, displayed more obvious surface protrusions, but lacked typical dendritic-like structures consistent with imDC morphology (days 1-5) (Fig. 1A). Upon TNF-α stimulation, the cell volumes expanded, with pronounced surface protrusions. A subset displayed a dendritic-like appearance indicative of mDCs, while others retained characteristics resembling imDCs (days 6-7) (Fig. 1A). RT-qPCR analysis revealed significant upregulation of miR-155 expression during DC maturation, with mDCs exhibiting higher miR-155 levels compared to imDCs (Fig. 1B). This suggests a potential role for miR-155 in maintaining DC immaturity.
Fig. 1
miR-155 expression in dendritic cells (DCs) with different maturity. A) Morphological change of DCs treated with 100 ng/ml TNF-α at different times. B) miR-155 expression level was measured by qRT-PCR in DCs (treated with 100 ng/ml TNF-α), and U6 expression was used as the internal control. *p < 0.05 vs. day 1, derived using Student’s t-test
Anti-155 inhibits the expression of major co-stimulatory molecules and MHC-II, maintaining an immature function
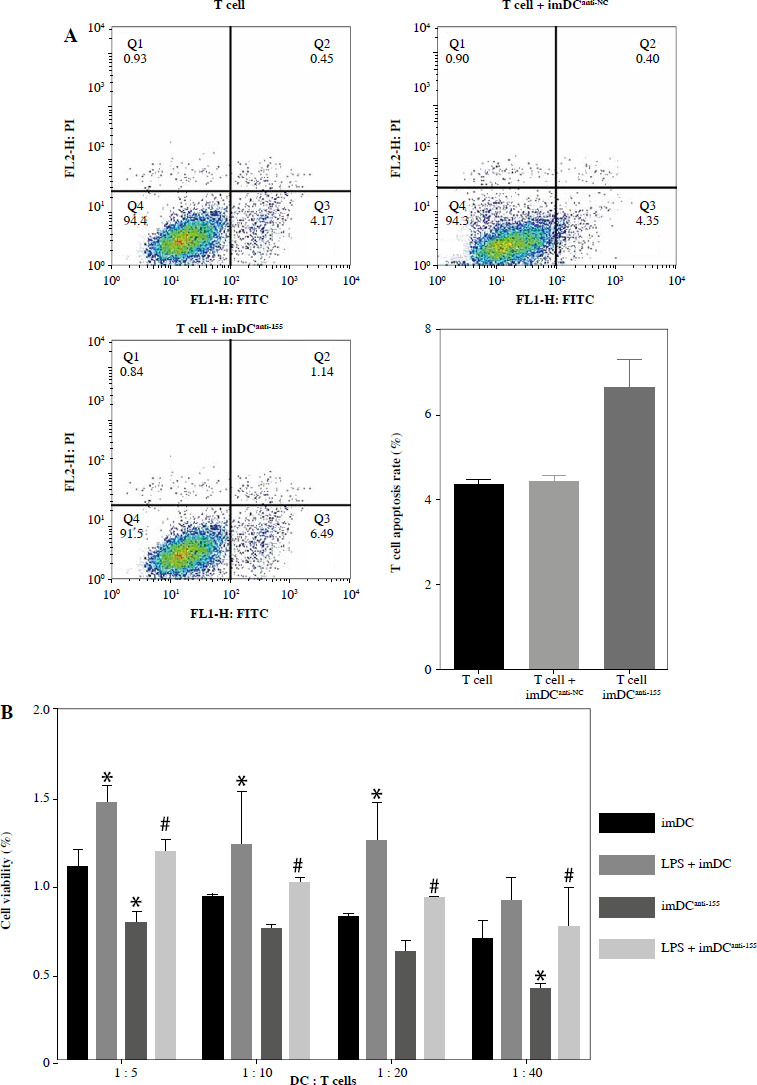
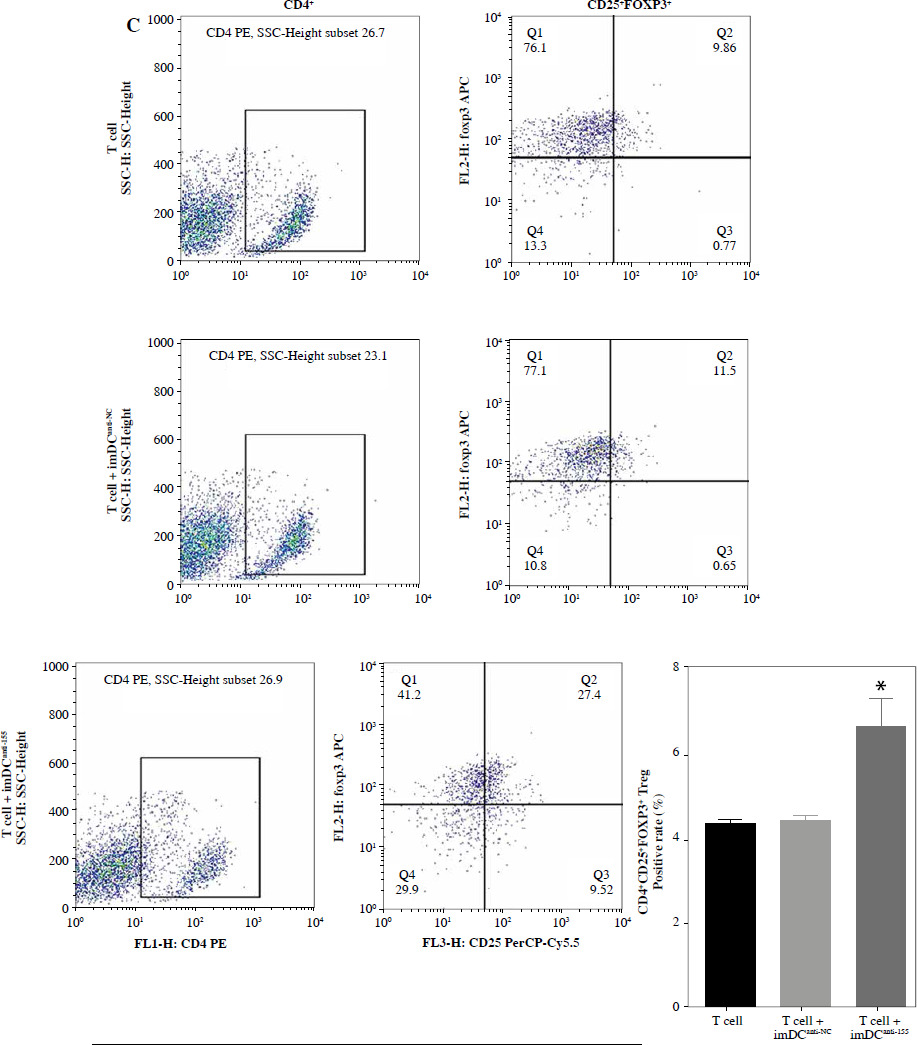
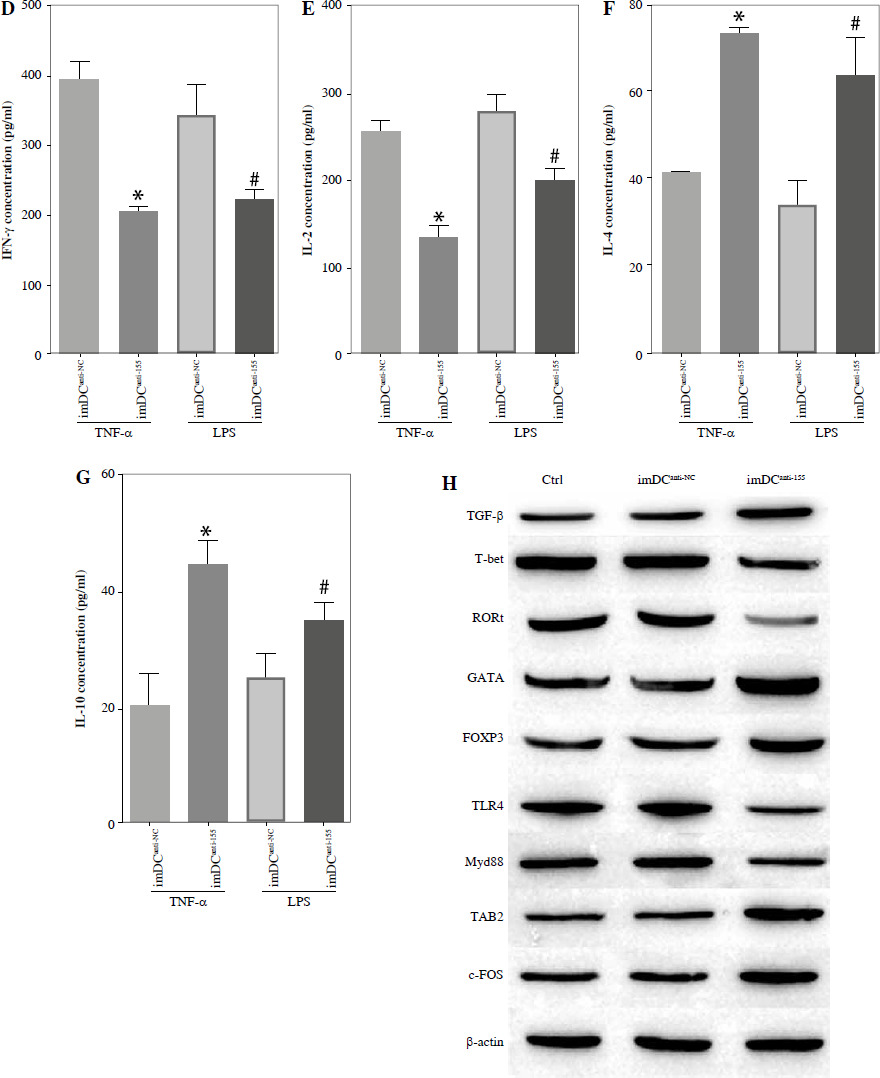
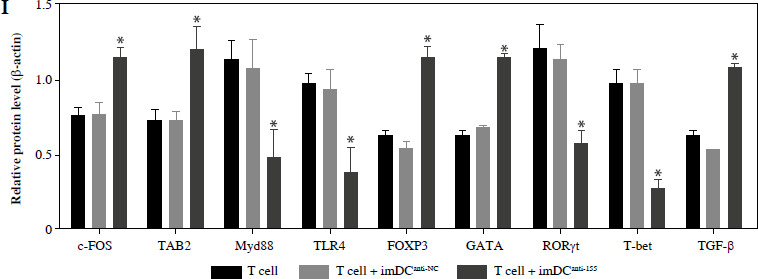
To assess the impact of miR-155 on DC functionality, we constructed imDCanti-155, which exhibited significantly reduced miR-155 mRNA levels. Flow cytometry analysis revealed decreased expression of CD80, CD86, and MHC II, along with increased CD1α expression in imDCanti-155 compared to mDCs (Fig. 2A). Morphologically, imDCanti-155 displayed an imDC-like appearance with an uneven surface, shallow folds, and fewer protrusions compared to mDCs (Fig. 2B-D). There was no difference in the apoptotic rate between mDCs, imDCs, and imDCanti-155 (Fig. 2E, F). Notably, imDCanti-155 exhibited elevated IL-10 and IL-4 levels, and reduced IFN-γ and IL-2 levels in culture supernatants compared to LPS-induced mDCs (Fig. 2G-J). Mixed lymphocyte reaction (MLR) experiments revealed increased T cell apoptosis and reduced proliferation when co-cultured with imDCanti-155, accompanied by an elevated proportion of Tregs (Fig. 3A-C). Additionally, imDCanti-155 contributed to the up-regulation of IL-10 and IL-4 in the co-culture supernatant, while down-regulating the levels of IL-2 and IFN-γ (Fig. 3D-G). Western blot analysis demonstrated that imDCanti-155 elicited up-regulation expression of GATA-3, FoxP3, and transforming growth factor β (TGF-β), and down-regulated expression of T-bet and RORγt (Fig. 3H, I). Meanwhile, imDCanti-155 can inhibit the expression of inflammatory factors in the MyD88/TLR4 signaling pathway (Fig. 3H, I). imDCanti-155 suppressed the expression of co-stimulators, inhibited the proliferation of T cells, induced the secretion of anti-inflammatory cytokines, and increased the number of Treg cells. These data suggest that anti-miR-155 can induce tolerance in DCs.
Fig. 2
The effect of anti-155 on dendritic cell (DC) biology. imDCs, imDCanti-NC, and imDCanti-155 were cultured for 48 h in the presence or absence of LPS (100 ng/ml). A) DC stained with directly conjugated CD80, CD86, CD1a, and MHC II. Abs for FACS analysis B) Morphological comparison of different DC. C) Scanning and D) transmission electron microscopy to detect the morphological differences in DCs E, F) Flow cytometry with 7-AAD/PE to detect DC apoptosis proliferation. G-J) ELISA to detect IFN-γ, IL-2, IL-4, and IL-10 levels in DC. Data are presented as mean ±SD and represent three experiments. *p < 0.05 vs. mDC, #p < 0.05 vs. imDCanti-NC, derived using Student’s t-test
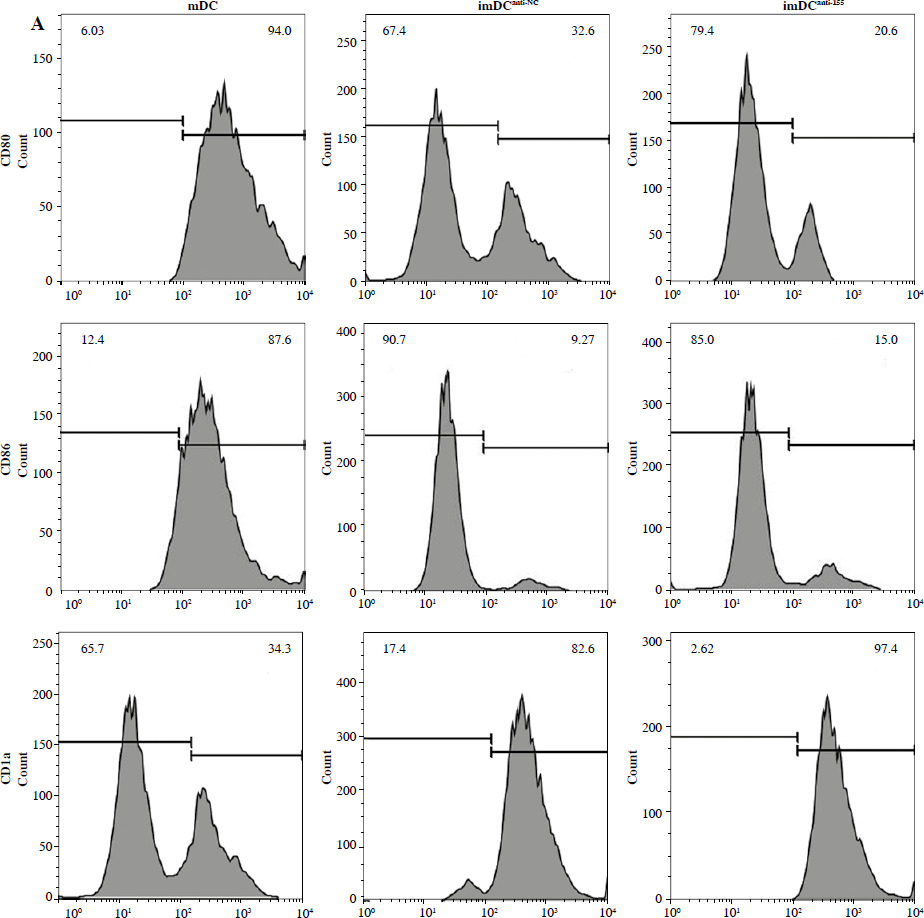
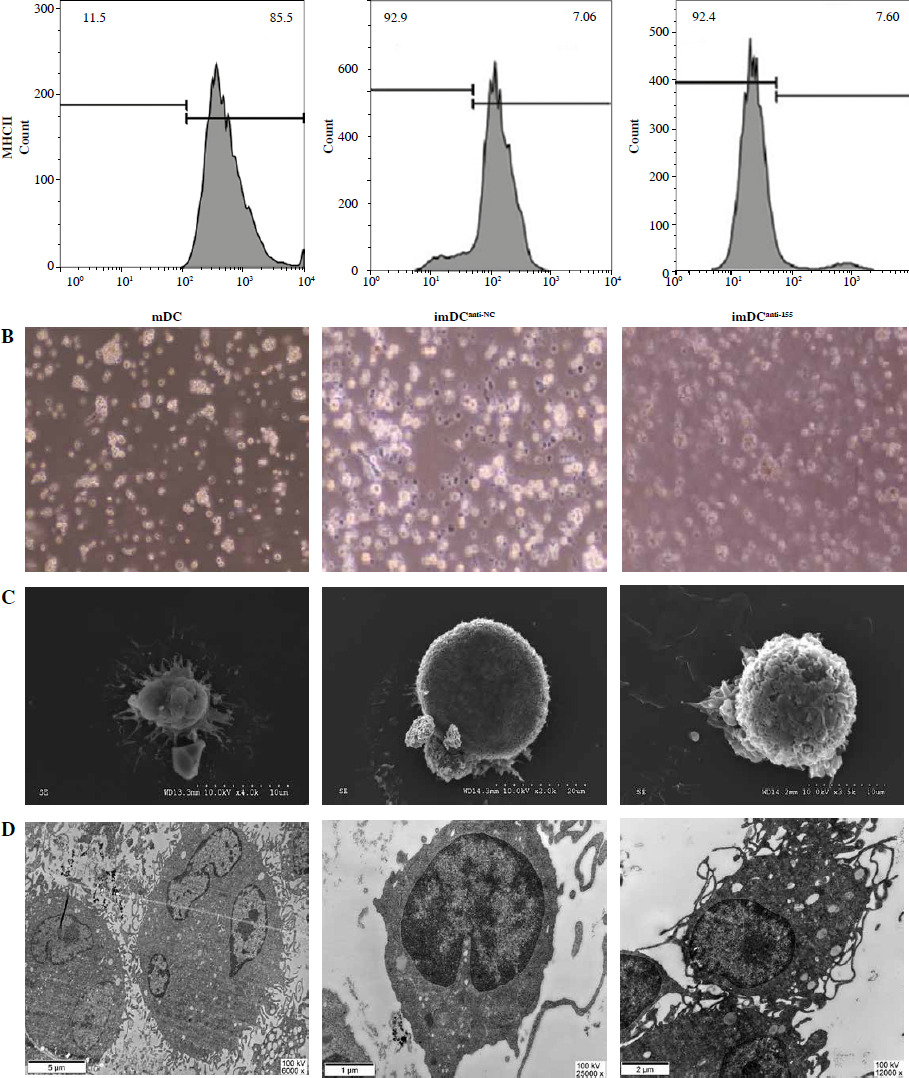
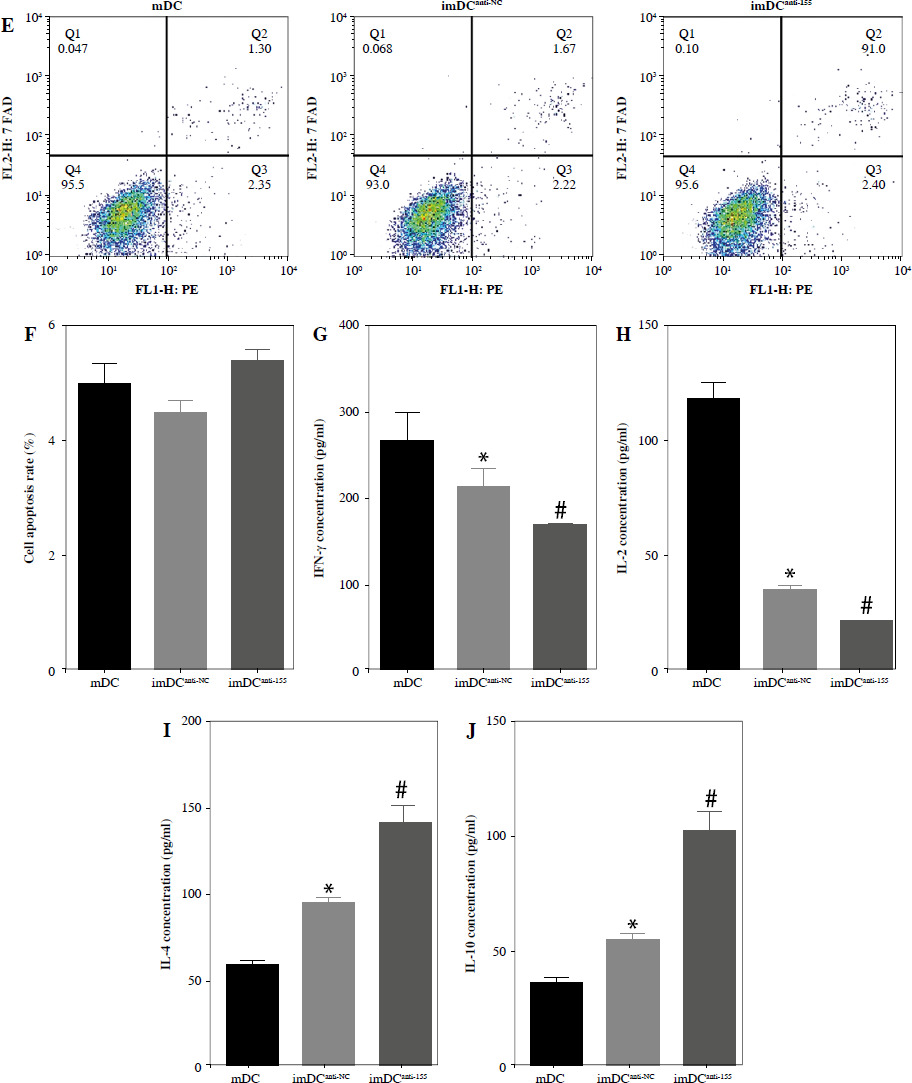
Fig. 3
The effect of imDCanti-155 on T cell biology. A) Apoptosis of T cells co-cultured with different dendritic cells (DCs) (2 : 1). B) The effect of DCs with different treatments on the proliferation capacity of T cells in mixed lymphocyte reaction (ratio = DC : T cells). Data are presented as mean ±SD and represent three experiments. *p < 0.05 vs. T cell group, #p < 0.05 vs. imDCanti-NC groups, derived using Student’s t-test C) Representative FACS results for the percentage of CD25+Foxp3+ Tregs in the four groups. Data are presented as mean ±SD and represent three experiments. *p < 0.05 vs. T cell group, #p < 0.05 vs. imDCanti-NC groups, derived using Student’s t-test D-G) Production of cytokines (IFN-γ, IL-2, IL-4, and IL-10) was analyzed by ELISA in supernatants from T cell co-cultures, in which imDCs, imDCanti-NC, and imDCanti-155 were cultured for 12 h in the absence or presence of LPS (100 ng/ml). H) Expression of T cell subpopulation biomarkers in T cells treated with different DCs for 48 h was determined by western blotting. β-actin was used as a loading control. Data are presented as mean ±SD and represent three experiments. *p < 0.05 vs. T cell group, #p < 0.05 vs. imDCanti-NC groups, derived using Student’s t-test I) Expression of T cell subpopulation biomarkers in T cells treated with different DCs for 48 h was determined by western blotting. β-actin was used as a loading control. Data are presented as mean ±SD and represent three experiments. *p < 0.05 vs. T cell group, #p < 0.05 vs. imDCanti-NC groups, derived using Student’s t-test
Anti-155 prolongs skin allograft survival and promotes Treg cell differentiation in rhesus monkeys
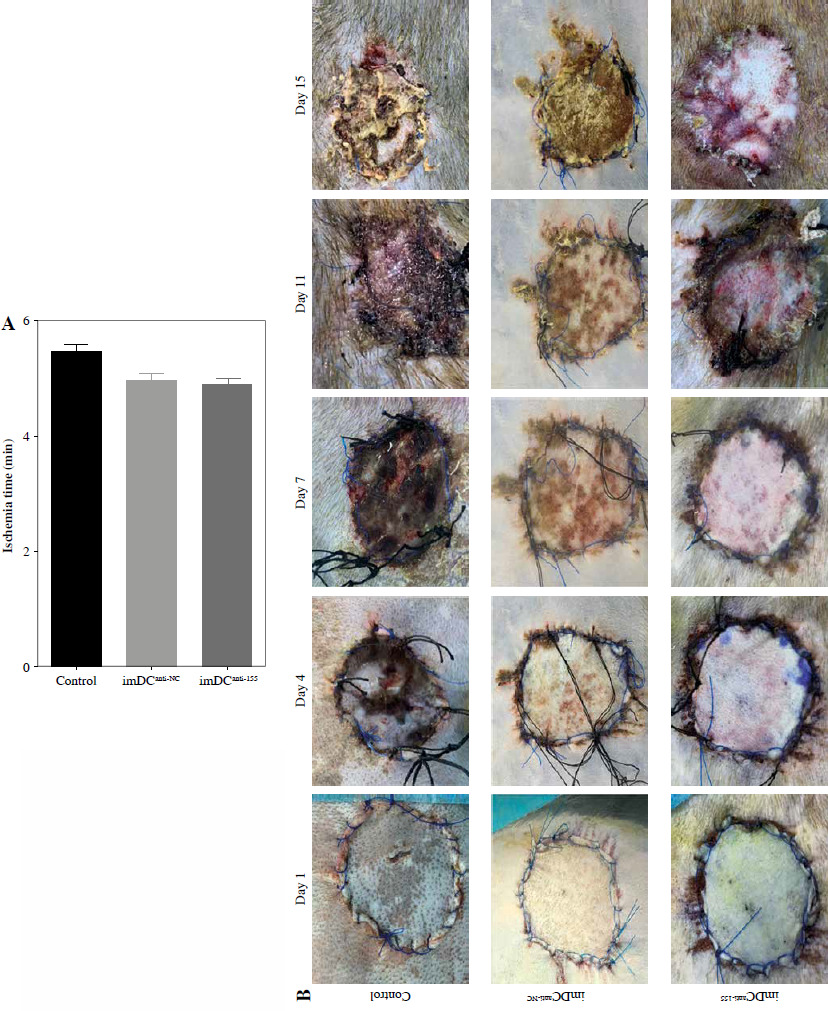
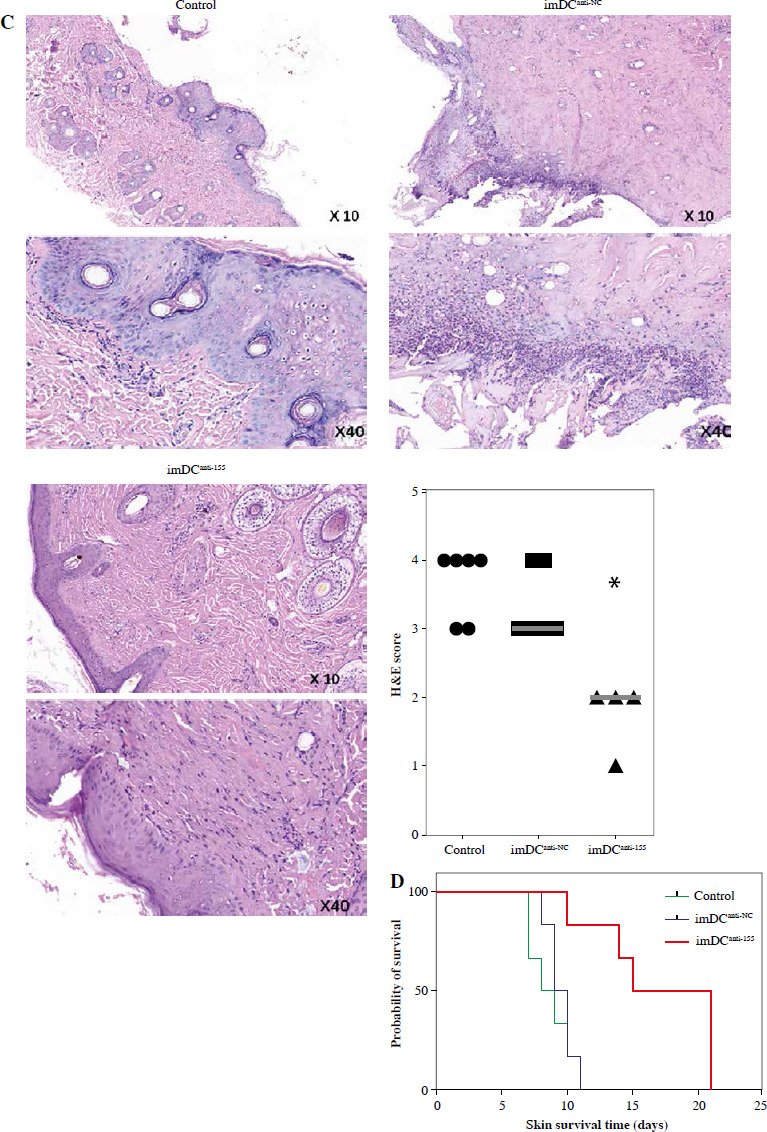
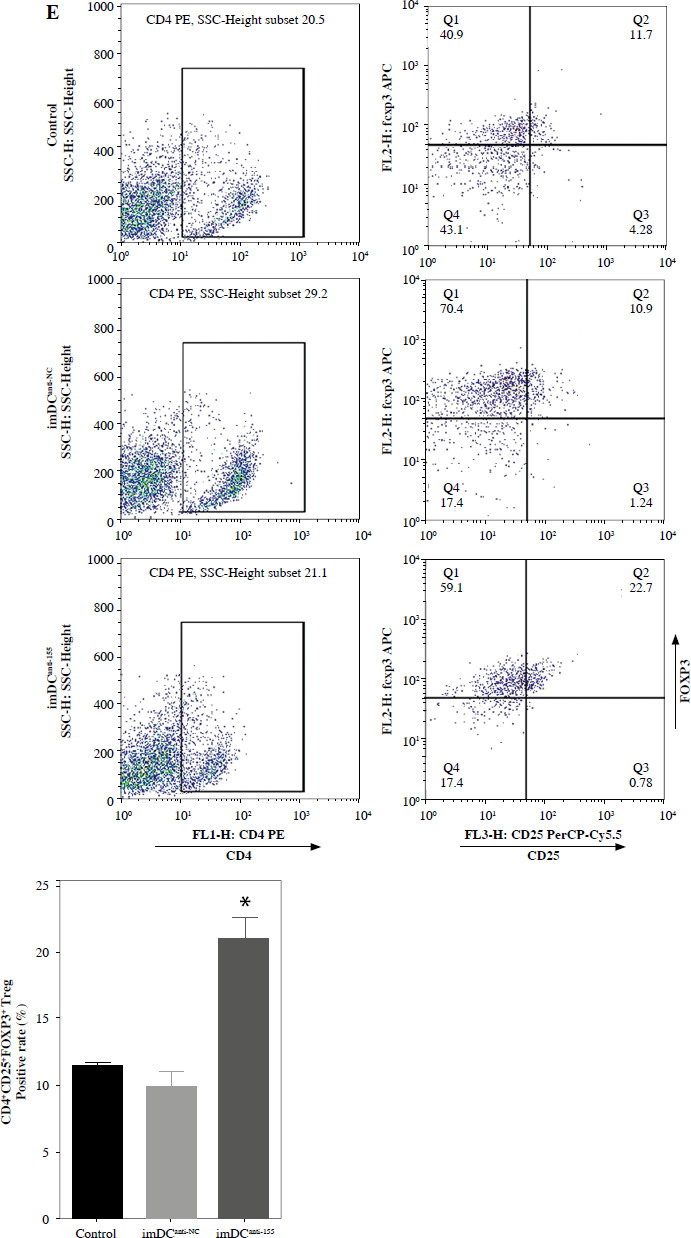
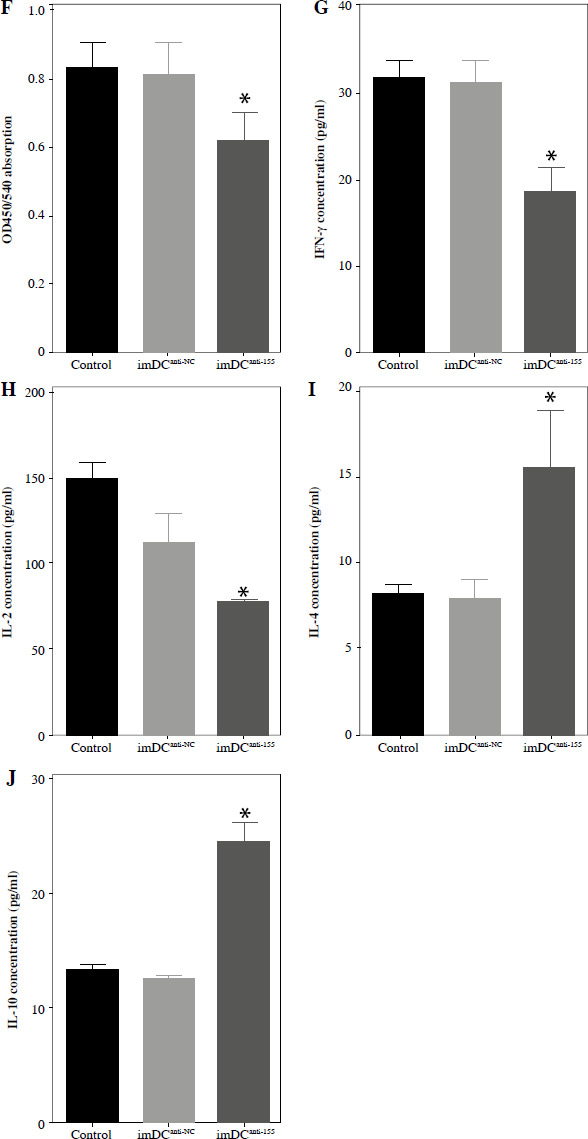
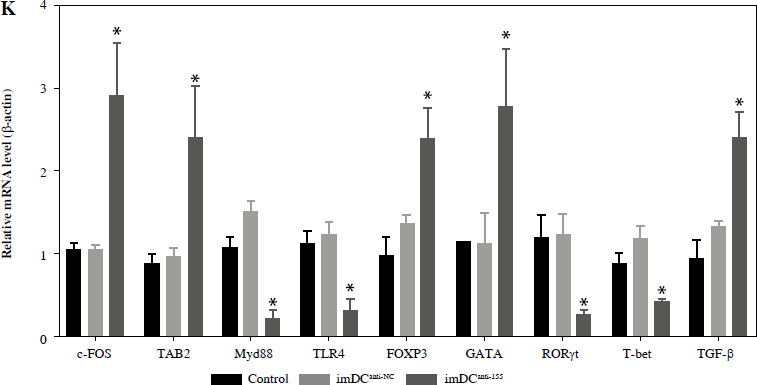
Two days prior to the skin transplantation procedure, various imDC suspensions (1 × 10⁶/ml) were administered intravenously. On the day of the experiment, mid-thickness skin grafting was performed, followed by the intravenous injection of imDC suspensions (1 × 10⁶/ml) in various treatment groups under the transplanted skin. The rhesus monkeys in each group displayed robust vital signs, exhibited a healthy demeanor, and maintained normal appetites. Additionally, there were no significant differences in ischemia time among the experimental groups (Fig. 4A). Subsequently, on the 7th day after surgery, compared with the imDC group, the transplanted skin within the first week exhibited an inflammatory reaction but gradually demonstrated sustained viability without significant necrosis or the formation of epidermal scabs (Fig. 4B). HE staining showed a high degree of cell rejection in the imDCanti-155 group, characterized by ulceration and severe acute infiltration of polymorphonuclear leukocytes and lymphocytes. Conversely, skin tissue sections from the imDC and imDCanti-NC groups displayed a well-defined skin tissue structure, mild local inflammatory cell infiltration, and signs of micro-angiogenesis, indicative of favorable growth and healing of the allograft skin (Fig. 4C). Crucially, the survival time of the transplanted skin in the imDCanti-155 group was significantly longer than that in the imDCanti-NC and imDCs from donor groups (Fig. 4D). T lymphocytes play a central role in transplant rejection development. Flow cytometry analysis revealed an increased percentage of CD4+CD25+FoxP3+ cells and suppressed splenocyte proliferation in monkeys receiving imDCanti-155 (Fig. 4E, F). Additionally, plasma levels of anti-inflammatory cytokines IL-10 and IL-4 were elevated, while levels of inflammatory cytokines IL-2 and IFN-γ were decreased in imDCanti-155 recipients (Fig. 4G-J). On the 7th day post-operation, qPCR analyses indicated altered expression levels of key factors involved in immune regulation, including TLR4, MyD88, RORγt, TAB2, T-BET, TGF-β, c-FOS, FOXP3, and GATA-3, favoring an immunotolerant state in imDCanti-155-treated monkeys (Fig. 4K). Collectively, these findings suggest that imDCanti-155 prolonged the survival of transplanted skin in the rhesus monkey model and induced the production of Tregs and anti-inflammatory cytokines.
Fig. 4
imDCanti-155 inhibited allograft rejection and prolonged skin allograft survival. A) Ischemia time for monkey. The recipient monkey in three groups was euthanized at 7 days after transplantation, and then allograft skin was harvested. B) Morphological characteristics of skin obtained from three groups. Data are presented as mean ± SD and represent three experiments. *p < 0.05 vs. control group; #p < 0.05 vs. imDCanti-NC groups, derived using Student’s t-test C) Morphological characteristics of skin stained with H&E (original magnifications, 100×, 400×). D) A Kaplan-Meier survival curve of skin allografts in three groups is presented, showing days after transplantation and relative survival (Kaplan-Meier survival analysis). Data are presented as mean ± SD and represent three experiments. *p < 0.05 vs. control group; #p < 0.05 vs. imDCanti-NC groups, derived using Student’s t-test E) Cells were stained with fluorescein-labeled antibodies (CD4-PE, CD25-Cy5, Foxp3-APC) and subsequently analyzed by flow cytometry. Data are presented as mean ± SD and represent three experiments. *p < 0.05 vs. control group; #p < 0.05 vs. imDCanti-NC groups, derived using Student’s t-test F) Proliferation of T cells in different groups was assessed using MLR by BrdU ELISA. The stimulator cells were monkey splenocytes treated with LPS. G-J) Assessment of graft-infiltrating inflammatory cytokines of serum in three groups at 7 days after transplantation. Data are presented as mean ±SD and represent three experiments. *p < 0.05 vs. control group, #p < 0.05 vs. imDCanti-NC groups, derived using Student’s t-test K) mRNA levels of T cell subpopulation biomarkers were examined by qRT-PCR. Data are presented as mean ±SD and represent three experiments. *p < 0.05 vs. control group, #p < 0.05 vs. imDCanti-NC groups, derived using Student’s t-test
Regulatory role of miR-155a in the SOCS1/JAK/STAT pathway
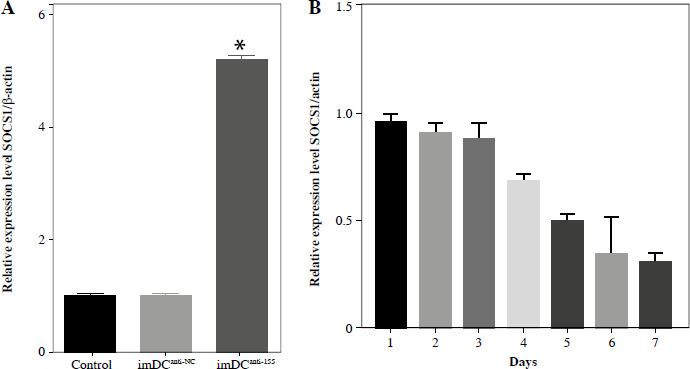
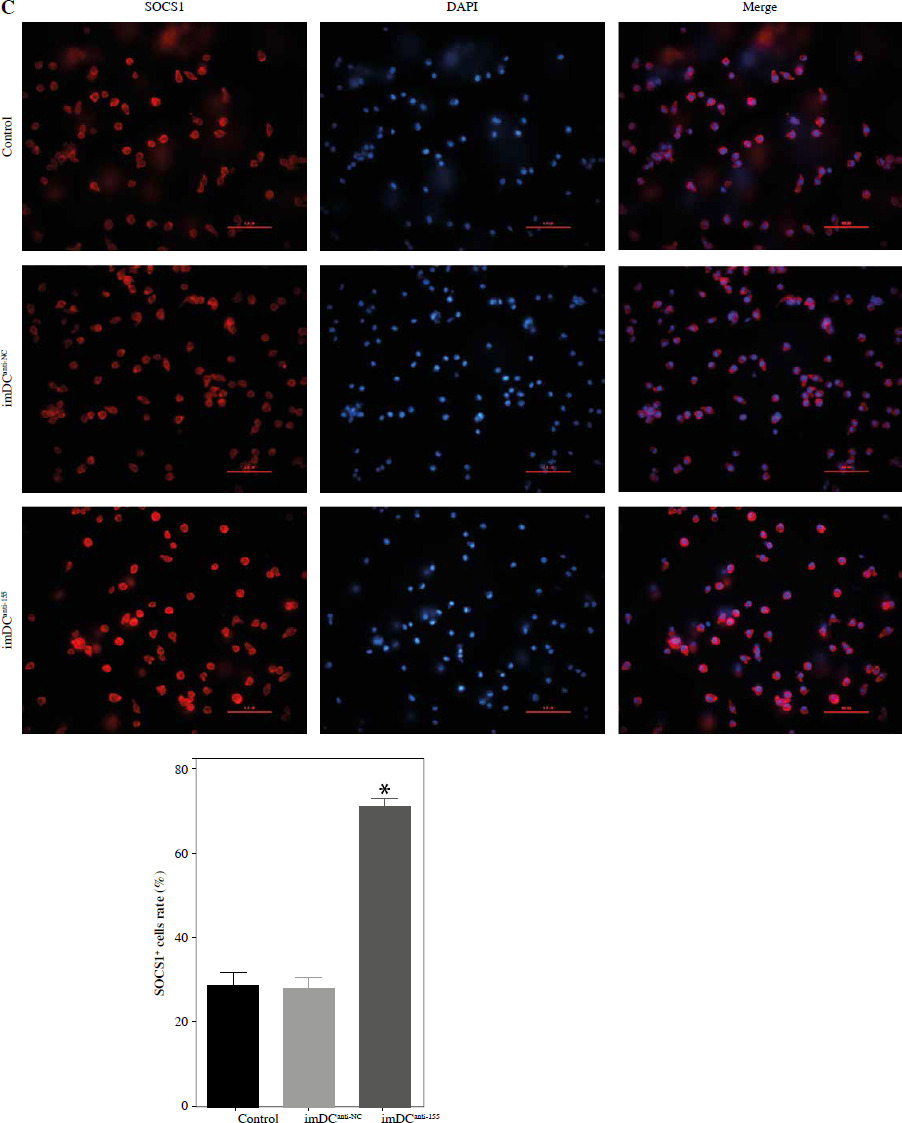
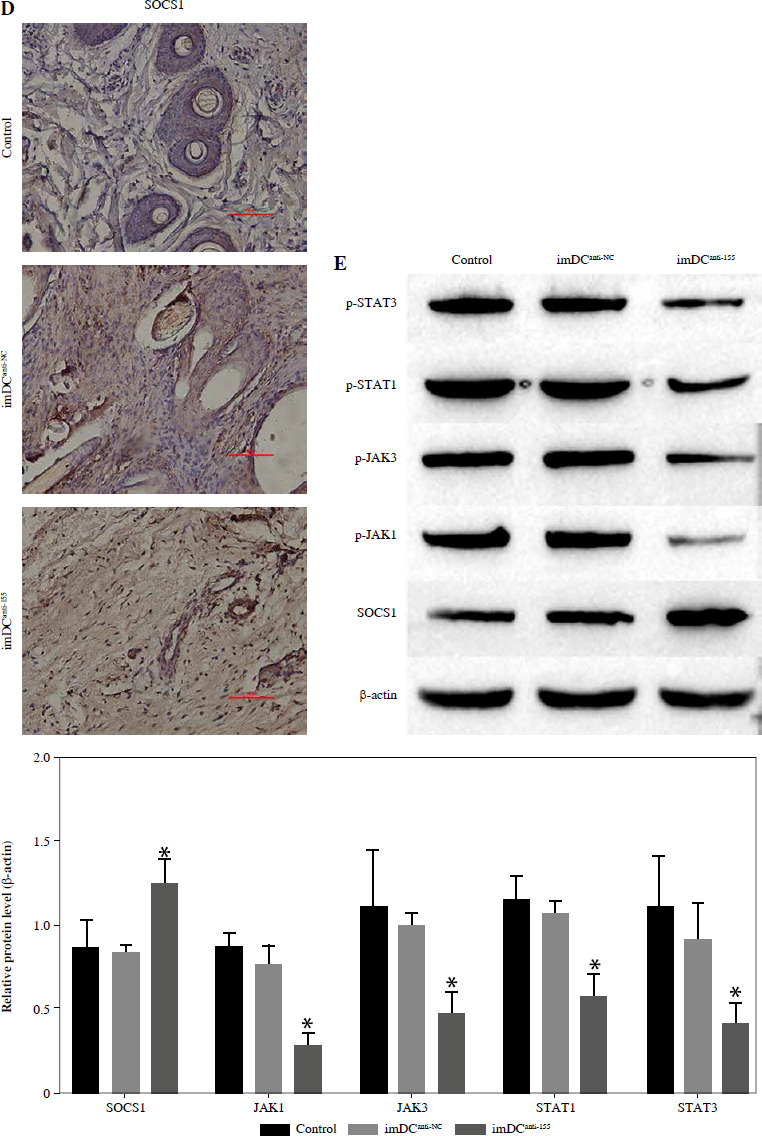
Studies previously reported that SOCS1 is a target of miR-155 and functions as an inducible negative feedback inhibitor of the JAK/STAT signaling pathway. In this study, imDCanti-155 exhibited upregulated SOCS1 expression both in vitro (Fig. 5A, B) and in skin grafts (Fig. 5C, D). The SOCS1-regulated JAK/STAT pathway may play a crucial role in the maturation and differentiation of DC cells. Immunoblotting data revealed that anti-155 led to a substantial increase in SOCS1 protein expression, accompanied by concomitant inhibition of the phosphorylation levels of JAK1, JAK3, STAT1, and STAT6 (Fig. 5E). This suggests that miR-155 plays a regulatory role in modulating the SOCS1/JAK/STAT pathway during DC-mediated immune responses.
Fig. 5
Regulatory role of miR-155a in the SOCS1/JAK/STAT pathway. A) SOCS1 expression of different dendritic cells (DCs) was tested by RT-PCR. B) SOCS1 expression level was measured by qRT-PCR in a mature process of DCs (treated with 100 ng/ml TNF-α), and β-actin expression was used as an internal control. Data are presented as mean ±SD and represent three experiments. *p < 0.05 vs. control group, #p < 0.05 vs. imDCanti-NC groups, derived by Student’s t-test Expression of SOCS1 of different DCs was examined by C) immunofluorescence staining. SOCS1 (red) and nuclei stained with DAPI (blue) are shown. Scale bars correspond to 50 µm. Data are presented as mean ±SD and represent three experiments. *p < 0.05 vs. control group, #p < 0.05 vs. imDCanti-NC groups, derived by Student’s t-test Expression of SOCS1 of different DCs was examined by D) immunohistochemistry staining. SOCS1 (red) and nuclei stained with DAPI (blue) are shown. Scale bars correspond to 50 µm. E) Immunoblot analysis of the indicated proteins in lysates of imDCs infected with anti-NC or anti-155, and then stimulated with LPS (100 ng/ml) for 12 h. Data are presented as mean ±SD and represent three experiments. *p < 0.05 vs. control group, #p < 0.05 vs. imDCanti-NC groups, derived by Student’s t-test
DCanti-155 promotes Treg cell differentiation and induces immunosuppressive cytokine secretion via SOCS1 in vitro
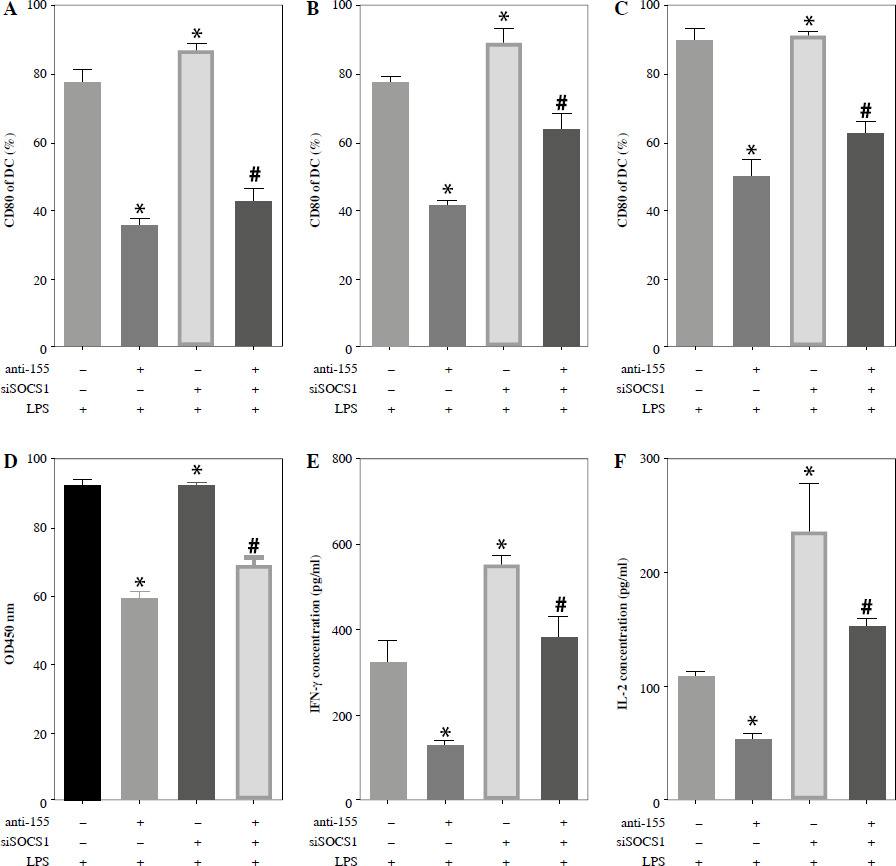
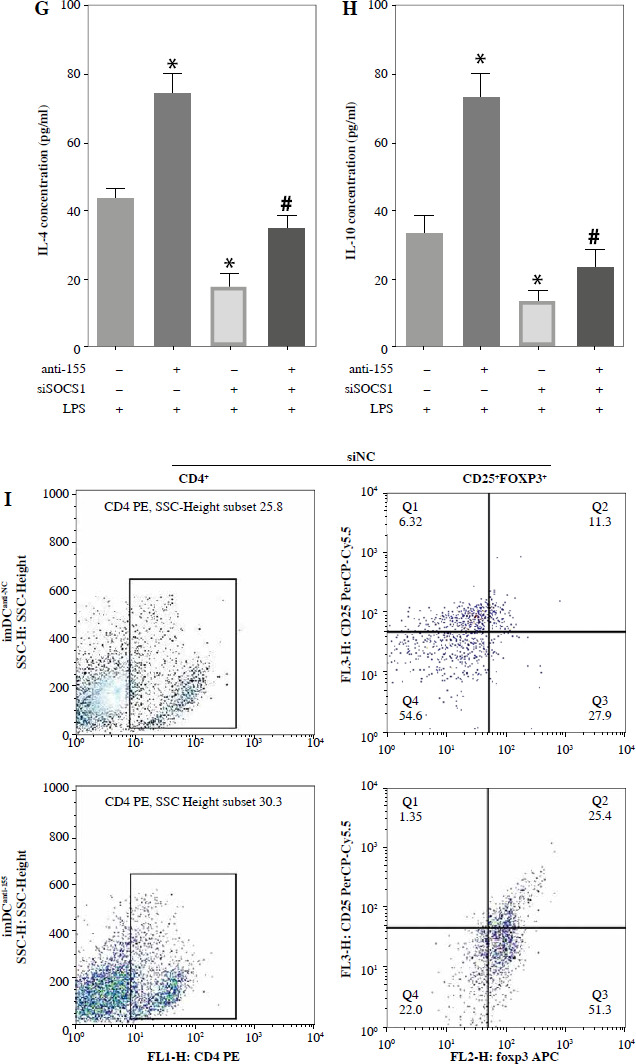
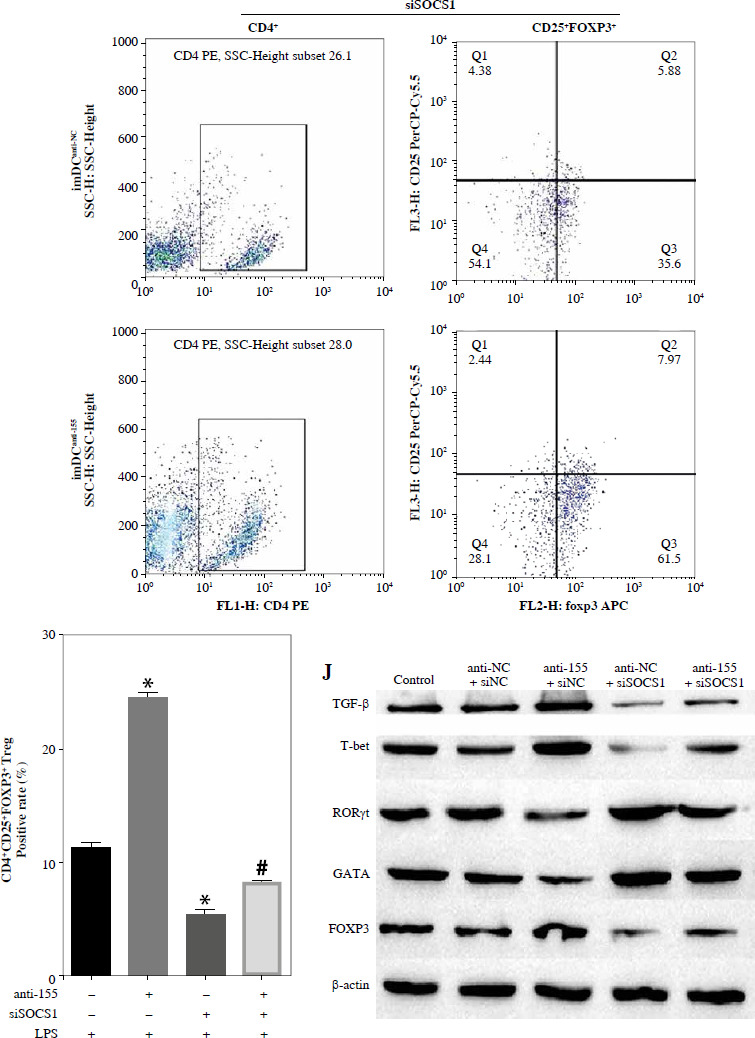
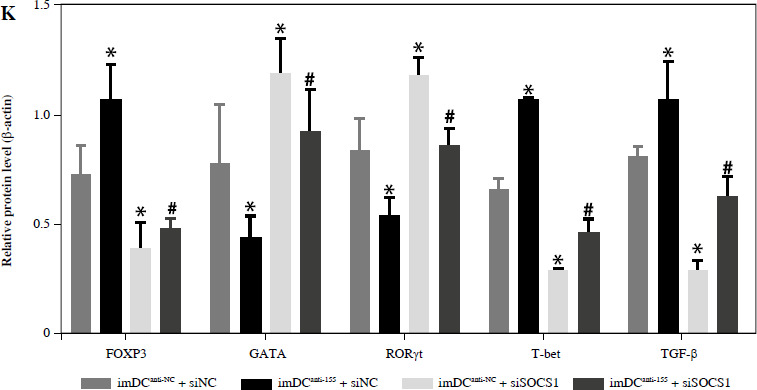
To further elucidate the role of SOCS1 in DCs, we conducted rescue experiments to investigate the effect of siSOCS1 on DC and Treg functions under anti-155 treatment. Flow cytometry analysis revealed that siSOCS1 expression reversed the anti-155-induced inhibition of co-stimulatory molecules in DCs (Fig. 6A-C). The BrdU assay results indicated that siSOCS1 treatment reversed the anti-155-induced inhibition of T-cell proliferation in DCs (Fig. 6D). Additionally, the increased number of Tregs induced by imDCanti-155 was significantly suppressed by siSOCS1 treatment (Fig. 6E). Compared with the anti-155 group, siSOCS1 increased the secretion levels of IFN-γ and IL-2 in the supernatant, while decreasing the secretion levels of IL-4 and IL-10 (Fig. 6F-I). Immunoblotting analyses showed that siSOCS1 downregulated the protein levels of FoxP3 and T-bet, and upregulated the protein levels of GATA-3, RORγt, and TGF-β (Fig. 6J). These data suggest the intricate role of the SOCS1/JAK/STAT signaling pathway in mediating the immune tolerance elicited by imDCanti-155.
Fig. 6
imDCanti-155 induces Treg cell expansion and immunosuppressive cytokine secretion via regulation of SOCS1. A-C) imDCanti-NC or imDCanti-155 were transfected with siNC or siSOCS1 in the presence of 200 ng/ml LPS for 12 h. The co-stimulators (CD80, CD86, and MHC II) were detected by flow cytometry. D) imDCanti-NC or imDCanti-155 were transfected with siSOCS1 in the presence of 100 ng/ml LPS for 12 h. Allogeneic T cells were cocultured with these DCs for 48 h. T-cell proliferation was assessed by BrdU ELISA. E, F) Production of cytokines (IFN-γ, IL-2) was analyzed by ELISA. *p < 0.05 vs. siNC + imDCanti-NC groups, #p < 0.05 vs. siSOCS1 + imDCanti-NC groups, derived using Student’s t-test G, H) Production of cytokines (IL-4, and IL-10) was analyzed by ELISA. I) Numbers of CD4+CD25+FoxP3+ Tregs were assessed by flow cytometry. Representative FACS results of three independent experiments for the percentage of Tregs. *p < 0.05 vs. siNC + imDCanti-NC groups, #p < 0.05 vs. siSOCS1 + imDCanti-NC groups, derived using Student’s t-test I) Numbers of CD4+CD25+FoxP3+ Tregs were assessed by flow cytometry. Representative FACS results of three independent experiments for the percentage of Tregs. J) Protein levels of indicated genes were examined by immunoblot. *p < 0.05 vs. siNC + imDCanti-NC groups, #p < 0.05 vs. siSOCS1 + imDCanti-NC groups, derived using Student’s t-test K) Protein levels of indicated genes were examined by immunoblot. *p < 0.05 vs. siNC + imDCanti-NC groups, #p < 0.05 vs. siSOCS1 + imDCanti-NC groups, derived using Student’s t-test
Discussion
Maintaining the immature state of DCs is crucial for preventing immune rejection. Various approaches, including pharmacological agents and genetic engineering, have been explored to generate regulatory DCs. In our study, we found that anti-155 effectively inhibited DC maturation, while imDCanti-155 promoted Treg differentiation and enhanced the secretion of anti-inflammatory cytokines. In a monkey model, we observed that imDCanti-155 prolonged the survival of transplanted skin and alleviated immune rejection following skin grafting. The immune tolerance mediated by imDCanti-155 is associated with the SOCS1/JAK/STAT signaling pathway, confirming miR-155’s role in DC maturation and immune tolerance.
miR-155 serves as a key regulator of the immune response, affecting various immune cell types, including T cells, natural killer cells, and myeloid cells such as DCs and MDSCs [23]. Several studies have demonstrated that miR-155 promotes Treg differentiation and activation through factors such as SOCS1 and SIRT1, thereby contributing to immune tolerance [24-27]. However, reports on the role of miR-155 in DC-mediated immune tolerance remain limited. Dunand-Sauthier et al. found that miR-155-mediated silencing of c-Fos expression is a conserved process essential for DC maturation and function [28]. Lind et al. demonstrated that miR-155 regulation of SHIP represents a unique axis regulating DC function in vivo [29]. Our findings in monkey DCs are consistent with these studies, indicating that miR-155 expression in DCs regulates Treg differentiation. Cytokine profiles, which are crucial in transplantation rejection, are modulated by miR-155, influencing DC maturation, function, and apoptosis, thereby affecting T lymphocyte activity and inflammatory cytokine production [30]. Previous studies have indicated that miR-155 is associated with CD4+ T cell differentiation, accompanied by changes in cytokine profiles [30]. This study demonstrated that altered cytokine profiles in T cells associated with miR-155 expression underscore its role in immune tolerance.
We further explored the function of imDCanti-155 in monkey allografts by infecting imDCs with an anti-155 lentivirus and evaluating their effects in a rhesus monkey skin transplantation model. Our results indicate enhanced immune tolerance induction by donor-derived imDCs following anti-155 lentivirus infection, possibly due to the maintenance of DC immaturity and their immunosuppressive roles. Furthermore, the imDCanti-155 group exhibited significant advantages in terms of appearance, VCA transplantation score, and median survival time of transplanted skin. This suggests that anti-155 lentivirus infection delayed the rejection of the transplanted skin. The infusion of ex vivo-generated DCregs can regulate allospecific T-cell responses and promote allograft tolerance [31]. Divito et al. [32] demonstrated that host DCs mediate the induction of donor-derived DCregs after infusion, thereby inducing Tregs and promoting allograft tolerance. Infusion of immature DCregs from host sources, without pulsing on the day of transplantation, can reduce the risk of host sensitization to donor antigens [33]. In the present study, we observed decreased pro-inflammatory cytokine levels and increased Treg expression in the imDCanti-155 group, emphasizing miR-155’s role in monkey skin graft immune tolerance.
miR-155 regulates the activation, differentiation, function, and apoptosis of CD4+ T cells by targeting multiple genes, with SOCS1 emerging as a critical factor in the immune system [33-35]. In monkey DCs, we confirmed that miR-155 regulates the SOCS1/JAK/STAT pathway, consistent with previous studies [24, 36]. SOCS1 modulates cytokine production and CD4+ T cell differentiation [37-39]. A higher number of Tregs was observed in the thymus and spleen of T cell-specific SOCS1-deficient mice, possibly due to upregulation of IL-2 secretion, which can enhance Treg proliferation. Importantly, SOCS1 is a target of miR-155 in Tregs [36]. Silencing SOCS1 counteracts the effects of anti-155, underscoring its role in promoting Treg differentiation. These findings highlight the intricate regulatory network involving miR-155, SOCS1, and Treg differentiation in immune tolerance.
Conclusions
In summary, inhibiting miR-155 could inhibit DC maturation, promote the proliferation and differentiation of Tregs, and increase the secretion of immunosuppressive cytokines. imDCanti-155 can alleviate acute skin graft rejection and prolong skin allograft survival in rhesus monkeys. Our findings highlight the potential of imDCanti-155 treatment as a novel therapeutic strategy to promote long-term allograft survival.