
Introduction
Muscle weakness and skin rashes are the main symptoms of dermatomyositis (DM), an uncommon autoimmune disease that predominantly affects the skin and muscles. Additionally, some individuals could have edema or joint pain [1]. Dermatomyositis is an idiopathic inflammatory myopathy [2, 3]. Among all myositis patients, DM has the greatest incidence [4]. Furthermore, compared to other types of myositis, DM patients are more likely to develop malignancies [5]. Environmental factors [6] and certain medications [7] are possible risk factors. Additionally, individuals with specific HLA types are more susceptible to DM [8]. Immunological factors such as immune cell infiltration [9], humoral immune response [10], autoantigens and autoantibodies [11], and cytokines [12], are also critical in DM pathogenesis. Therefore, analyzing expression of immune-related genes provides a potential approach to gain deeper insights into the mechanisms underlying DM pathogenesis. Moreover, it can offer clues and ideas for exploring potential therapeutic targets.
Numerous disorders have been studied using microarray technology in medicine [13]. It is a high-throughput gene expression profiling technique that identifies disease-associated target genes [14], possible molecular mechanisms [15], diagnosis, and prognosis [16]. For example, Peng et al. [17] conducted transcriptomic analysis of long non-coding RNAs in DM using microarray analysis and outlined aberrant lncRNAs in DM. Xie et al. [18] identified 20 differentially expressed genes (DEGs) linked to DM using cDNA microarray. Xiao et al. [19] discovered 10 genes as possible biomarkers for diagnosing DM through microarray and bioinformatics analysis. As DM is an autoimmune myopathy, immune response plays a significant role in its occurrence [20], but there is limited research on immune-related genes in DM. Therefore, the combination of microarray and bioinformatics analysis can be utilized to explore immune-related genes closely associated with DM development and evaluate the effectiveness of constructing a diagnostic model based on them.
Thus, we obtained microarray datasets GSE46239 and GSE39454 from the GEO database as the DM training set after removing batch effects. DEGs were identified and enrichment analysis was conducted. Intersection of DEGs with immune-related genes yielded immune DEGs, and a PPI network was built. Subsequently, a diagnostic model was built by LASSO, and validation was performed using the microarray dataset GSE143323. CIBERSORT analysis was utilized to investigate immune cell infiltration in DM, and correlation between diagnostic genes and immune cells was analyzed using the corrplot R package. Finally, levels of HLA genes in DM and their correlation with diagnostic genes were assayed. The findings laid a foundation for clinical diagnostic research on DM.
Material and methods
Data collection
GSE46239, GSE39454, and GSE143323 datasets were obtained from GEO (https://www.ncbi.nlm.nih.gov/). GSE46239 consisted of 5 normal samples and 8 DM samples, GSE39454 consisted of 4 normal samples and 48 DM samples, and GSE143323 consisted of 20 normal samples and 39 DM samples. Batch effects of datasets GSE46239 and GSE39454 were removed, and the datasets were merged into one training set, while GSE143323 served as the validation set.
DEG analysis
The R package SVA [21] was utilized to merge and batch-correct the GSE46239 and GSE39454 datasets. Principal component analysis (PCA) was performed to assess correction results. The standardized gene expression matrix file was downloaded, and the limma R package was used to analyze DEGs between DM and normal samples. The threshold for DEGs was set as |logFC| > 0.585 and p-value < 0.05.
KEGG and GO enrichment analyses
The clusterProfiler package was used to perform GO analysis, including biological processes, cellular components, and molecular functions, as well as KEGG pathway enrichment analysis for the DEGs between DM and normal samples. A significance threshold of p < 0.05 was applied.
Immune-related DEGs and PPI network analysis
Genes associated with immunity were acquired from immPort (https://www.immport.org/shared/home). The intersection of immune-related genes and DEGs resulted in immune-related DEGs. A PPI network of immune-related DEGs was built through STRING (https://string-db.org/), with a confidence score > 0.9.
Construction and validation of the diagnostic model based on immune-related DEGs
The LASSO model was built using the glmnet R package according to gene expression data of immune-related DEGs. The minimum lambda value obtained from the LASSO model was applied as a reference to determine optimal variables. Logistic regression analysis was performed using the genes from the LASSO model, and the diagnostic model index was calculated using the following formula:
Index = ExpGene1 * Coef1 + ExpGene2 * Coef2 + ExpGene3 * Coef3 + ... + ExpGeneN * CoefN
where ExpGene refers to gene expression and Coef represents the regression coefficient of the gene. Additionally, the pROC R package was used to generate a ROC curve to test the stability and sensitivity of the LASSO model. The effectiveness of the diagnostic model and candidate diagnostic genes was further validated using the GSE143323 dataset.
Correlation of immune cell infiltration with diagnostic markers
CIBERSORT, a deconvolution algorithm, was used to quantify immune cell infiltration (22 different cell types) in the gene expression profiles of DM. Differences in immune cell infiltration between DM and normal samples were calculated by CIBERSORT, and visualization was performed with the ggplot2 R package. Correlation analysis between infiltrating immune cells and diagnostic markers was conducted using the corrplot R package.
HLA gene expression evaluation and its correlation with diagnostic markers
The levels of HLA genes in DM and normal samples were analyzed, and box plots visualizing the results were drawn with the ggplot2 R package. Pearson correlation analysis was employed to assess the correlation between diagnostic markers and HLA genes, and visualization was performed with the ggplot2 R package.
Blood sample collection
Blood samples were collected from 6 DM patients and 6 healthy volunteers. All DM patients met the diagnostic criteria of Bohan and Peter and were over 18 years old. Patients with other concurrent autoimmune diseases were excluded. Written informed consent was obtained from all participating patients and healthy volunteers. This study was approved by the Ethics Committee of Sanming First Hospital Affiliated to Fujian Medical University. Venous blood (10 ml) of patients and volunteers was collected, and serum was collected after centrifugation.
qRT-PCR
Total RNA was extracted from serum using the TRIzol reagent (Invitrogen, USA) according to the manufacturer’s instructions. Then, the RNA was reverse transcribed into cDNA using the Takara kit (Dalian, China). Finally, qRT-PCR was performed in the ABI Prism 7900HT system (Thermo Fisher Scientific, USA) using SYBR Green premix (Bio-Rad Laboratories, Hercules, CA, U.S.). GAPDH served as the internal parameter. The primer sequence is shown in Table 1.
Table 1
Primer sequences
Results
Analysis of DEGs and functional enrichment analysis
First, we used the R package SVA to merge GSE46239 and GSE39454 datasets from the GEO database and performed batch effect correction. The PCA analysis demonstrated the successful removal of batch effects (Fig. 1A, B). Subsequently, we combined these two datasets into one training set. DEGs between DM and normal samples were identified using a threshold of |LogFC| > 0.585 and adjusted p-value < 0.05, resulting in a total of 350 DEGs (318 downregulated and 32 upregulated) (Supplementary Table 1, Fig. 1C).
Fig. 1
Analysis of differentially expressed genes (DEGs) between dermatomyositis (DM) and normal samples. A) PCA before batch correction of GSE46239 and GSE39454. B) PCA after batch correction of GSE46239 and GSE39454. C) Volcano plot of DEGs between DM and normal samples. D) GO enrichmzent analysis based on DEGs. E) KEGG enrichment analysis based on DEGs
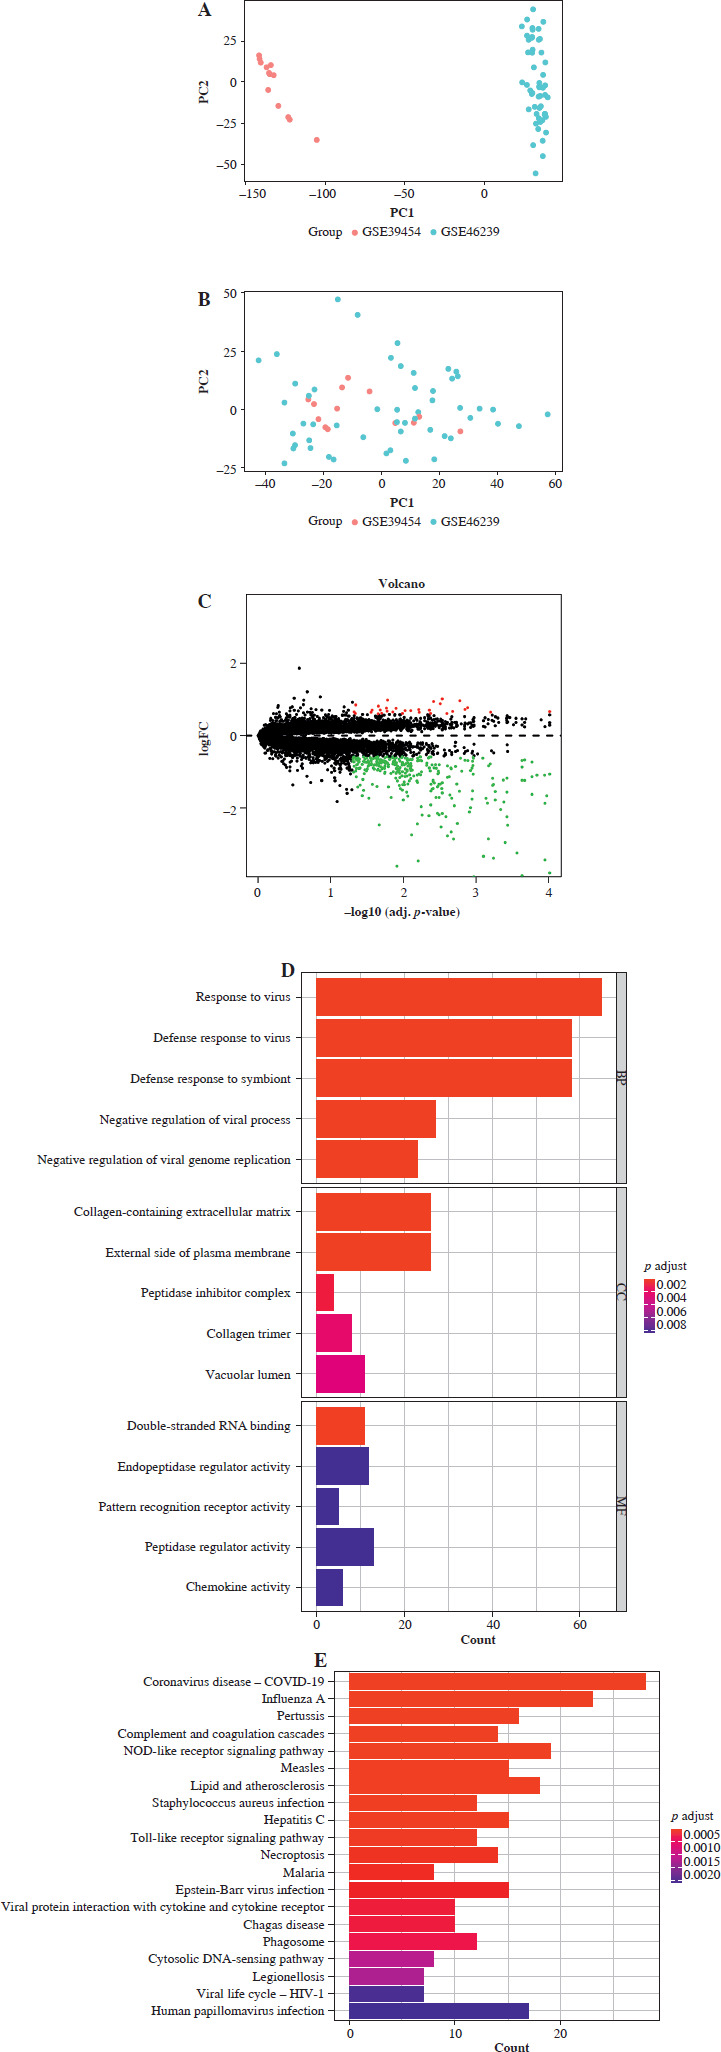
GO analysis presented enrichment of DEGs in biological processes related to response to virus, collagen-containing extracellular matrix, and double-stranded RNA binding (Fig. 1D). KEGG analysis exhibited enrichment of DEGs in pathways such as Coronavirus disease – COVID-19, Influenza A, NOD-like receptor signaling pathway, and Toll-like receptor signaling pathway (Fig. 1E). These data suggested a close association between DM occurrence and viral response, immune-associated biological processes, and metabolic pathways.
Generation and validation of the diagnostic model
A total of 1793 immune-related genes were downloaded from immPort (https://www.immport.org/shared/home) (Supplementary Table 2). By intersecting these genes with the DEGs, we identified 71 immune-related DEGs (Fig. 2A). Furthermore, we established a PPI network for 71 immune-related DEGs through STRING, with a confidence score > 0.9. The resulting network consisted of 43 nodes and 150 edges (Fig. 2B).
Fig. 2
Construction and validation of the diagnostic model. A) Upset plot showing the intersection between immune genes and differentially expressed genes (DEGs). B) PPI network of immune-related DEGs. C) Coefficient distribution plot of immune-related DEGs. D) LASSO coefficient spectrum of immune-related DEGs. E) ROC curve analysis of the diagnostic model in the training set F) ROC curve analysis of the diagnostic model in the validation set. G) ROC curve analysis of model genes in the training set H) ROC curve analysis of model genes in the validation set
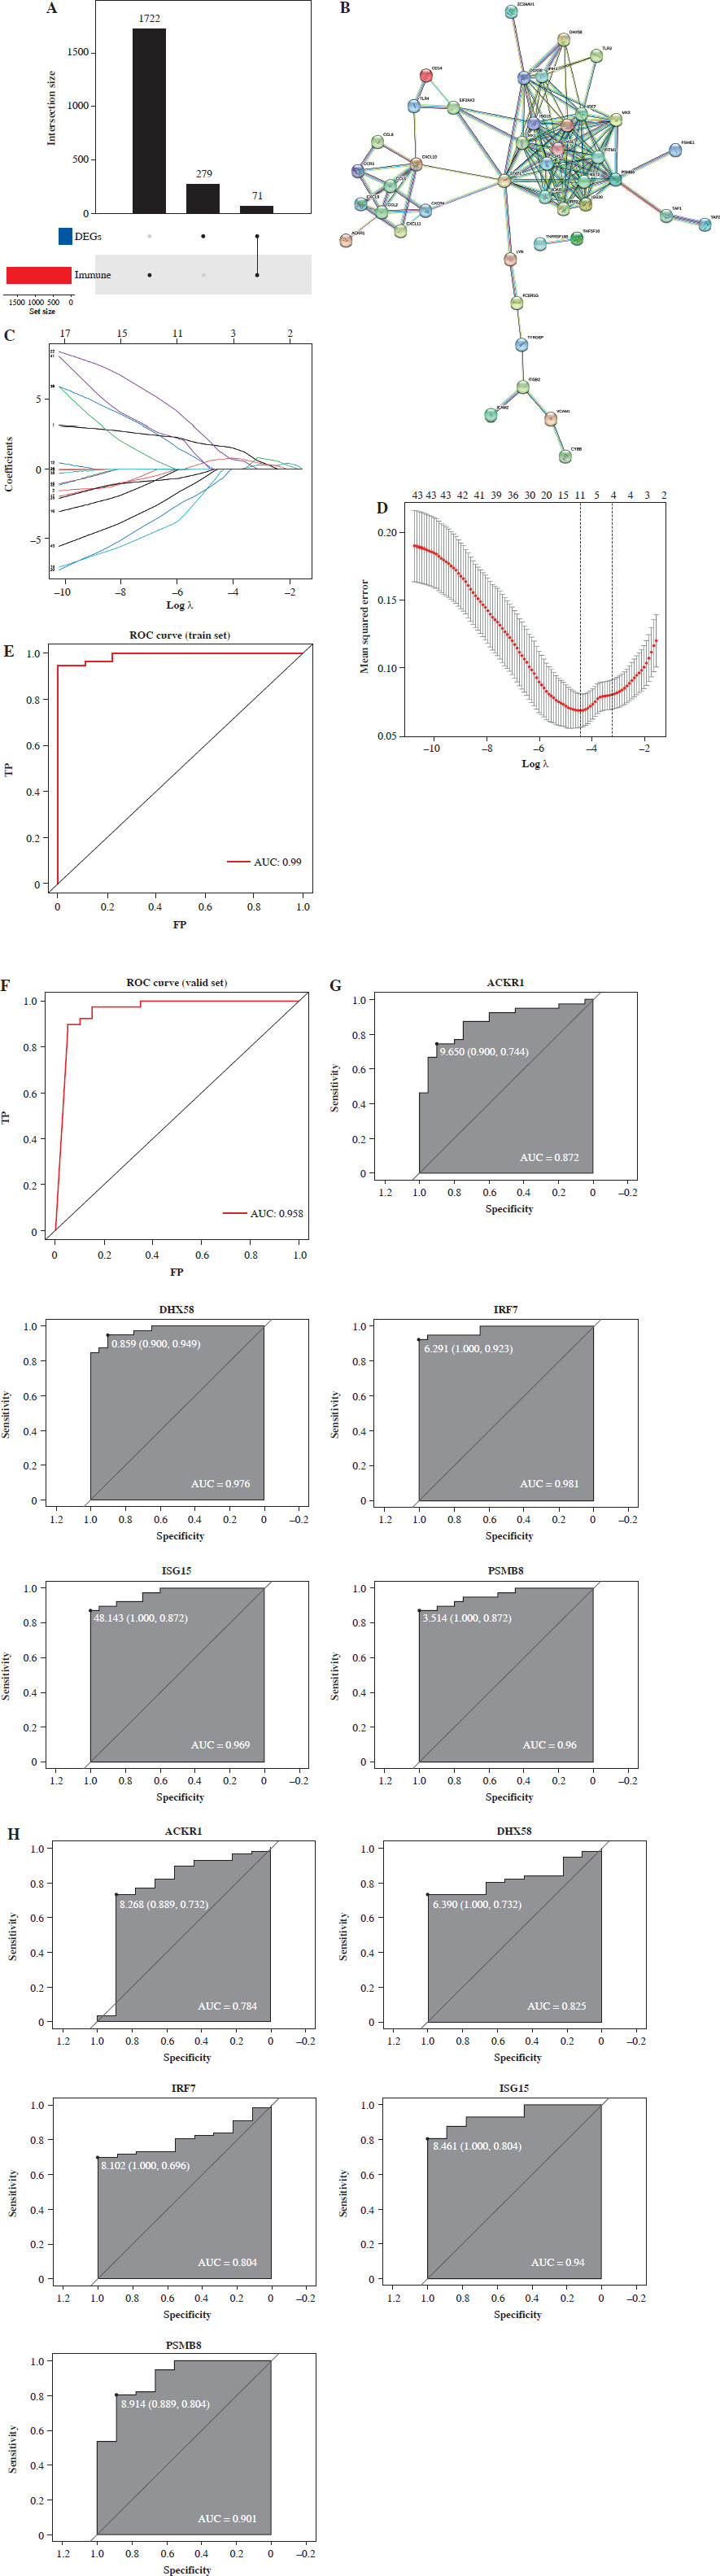
We incorporated immune-related DEGs into LASSO regression to generate a diagnostic model for distinguishing DM samples from normal samples. The minimum lambda value was used as a reference to determine optimal variables to include in the model. Finally, ACKR1, DHX58, IRF7, ISG15, and PSMB8 were selected as key genes to build the model (Fig. 2C, D). We computed the index for each sample using the LASSO model as follows:
Index = ACKR1 * 1.65 – DHX58 * 0.17 – IRF7 * 0.73 + ISG15 *1.21 + PSMB8 * 0.71
The model accuracy was assessed using ROC curve analysis, and an AUC of 0.99 was obtained in training set (Fig. 2E). To test diagnostic performance, we used the GSE143323 dataset as a validation set and found an AUC of 0.958 in the validation set (Fig. 2F), indicating a strong diagnostic ability. We analyzed diagnostic performance of model genes in the training and validation sets. In the training set, ACKR1, DHX58, IRF7, ISG15, and PSMB8 had AUC values of 0.872, 0.976, 0.981, 0.969, and 0.96, respectively (Fig. 2G). In the validation set, AUC values for ACKR1, DHX58, IRF7, ISG15, and PSMB8 were 0.784, 0.825, 0.804, 0.94, and 0.901, respectively (Fig. 2H). These findings indicated that ACKR1, DHX58, IRF7, ISG15, and PSMB8 also had high diagnostic value.
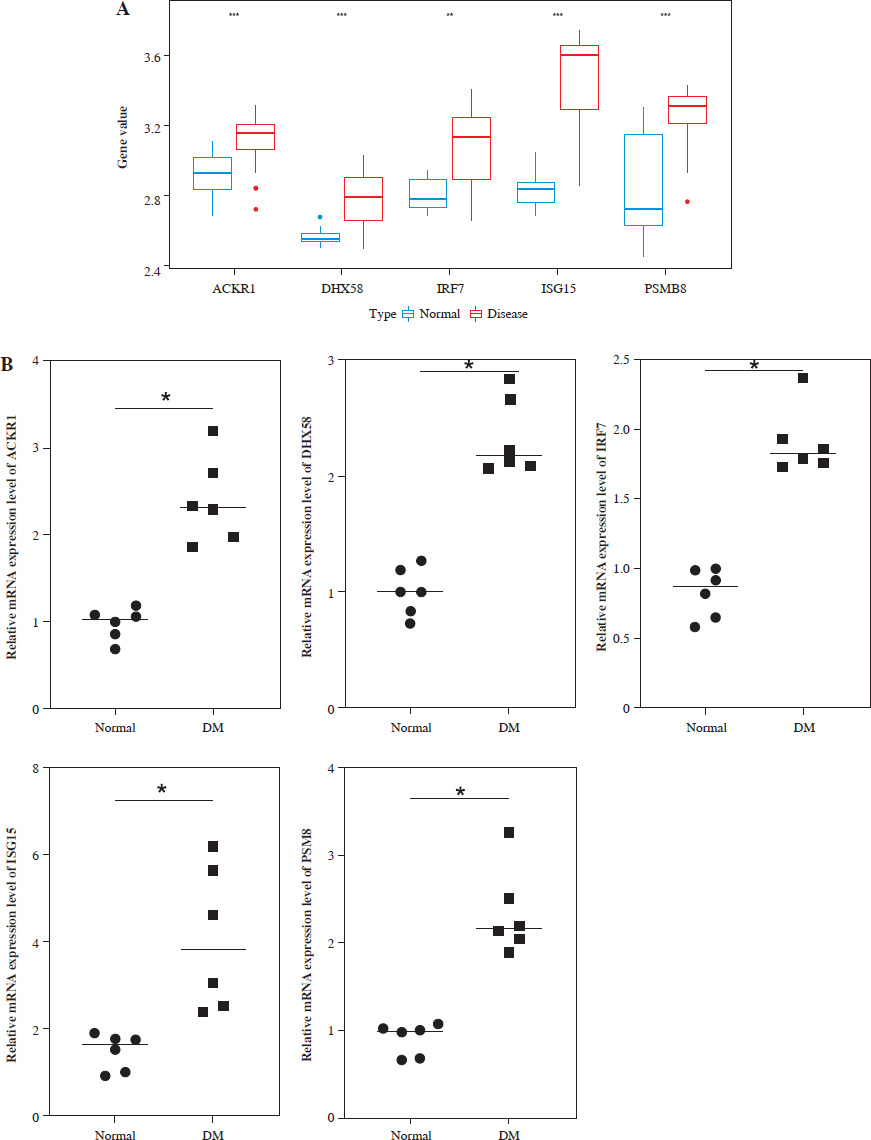
Furthermore, the expression levels of ACKR1, DHX58, IRF7, ISG15, and PSMB8 in DM were preliminarily analyzed in the training set. The results showed that these 5 genes were significantly overexpressed in DM (p < 0.05, Fig. 3A). We verified the gene expression levels of the model by collecting serum samples from DM patients and healthy volunteers. The results showed that, compared with the normal group, the expression levels of ACKR1, DHX58, IRF7, ISG15, and PSMB8 in DM patients were significantly higher (p < 0.05, Fig. 3B).
Fig. 3
Prediction and validation of model gene expression levels. A) Prediction of the difference in expression of model genes between dermatomyositis (DM) patients and normal group in the training set. B) qRT-PCR was used to verify the expression level of model genes. *p < 0.05, **p < 0.01, ***p < 0.001
Correlation analysis of immune cell infiltration and HLA genes with diagnostic genes
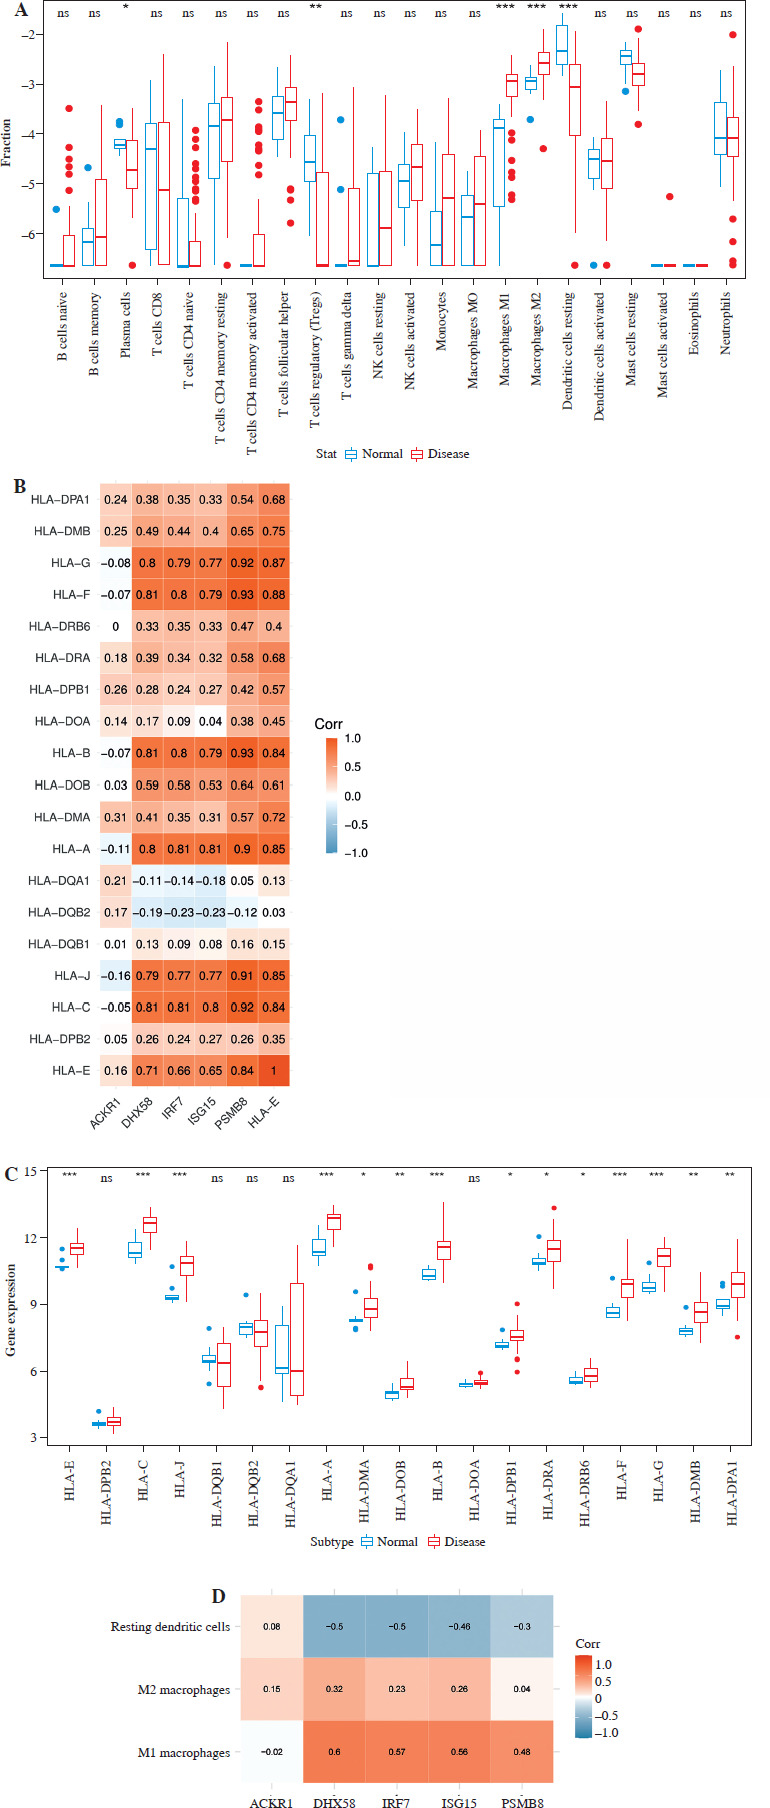
Proportions of immune cell infiltration in DM and normal tissues were calculated using the CIBERSORT algorithm. The results showed a significantly higher infiltration degree of M1 and M2 macrophages in DM samples compared to the control group. Conversely, the infiltration degree of plasma cells, regulatory T cells (Tregs), and resting dendritic cells was higher in normal samples than in DM samples (Fig. 4A). Correlations between diagnostic genes and differentially infiltrating immune cells were analyzed. ACKR1 was positively correlated with resting dendritic cells and M2 macrophages, while it was negatively correlated with M1 macrophages. DHX58, IRF7, ISG15, and PSMB8 were positively correlated with both M1 and M2 macrophages, and negatively correlated with resting dendritic cells (Fig. 4B). Furthermore, analysis of HLA expression in DM and normal tissues revealed significantly upregulated expression of HLA-E, HLA-C, HLA-J, HLA-A, HLA-B, HLA-F, HLA-G, HLA-DMA, HLA-DOB, HLA-DPB1, HLA-DRA, HLA-DRB6, HLA-DMB, and HLA-DPA1 in DM samples. These HLA genes were positively correlated with DHX58, IRF7, ISG15, and PSMB8, indicating a positive association (Fig. 4C, D).
Fig. 4
Correlation analysis of immune cell infiltration and HLA genes with diagnostic genes. A) Boxplot showing differential infiltration of 22 immune cells. B) Correlation between diagnostic genes and immune cells. *p < 0.05, **p < 0.01, ***p < 0.001, ns p > 0.05 C) Boxplot showing differential expression of HLA genes. D) Correlation between diagnostic genes and HLA genes. *p < 0.05, **p < 0.01, ***p < 0.001, ns p > 0.05
Discussion
Dermatomyositis can cause muscle weakness, skin damage, and multi-organ complications [1]. Current research indicates that the interferon type 1 (IFN-1)-induced immune response plays a pivotal role in DM pathogenesis [22, 23]. Some studies have explored diagnostic biomarkers using bioinformatics techniques and gene expression profiling [18, 24]. However, there is limited research on diagnostic genes related to immune-associated genes in DM. We applied the LASSO algorithm to establish a diagnostic model of key genes and evaluated its diagnostic efficacy using ROC curves. We assessed the association of immune cell infiltration and HLA genes with diagnostic genes. Our study provides a foundation for diagnosis of DM according to the diagnostic model of immune-related genes.
By merging two DM-related GEO datasets, we identified 350 DEGs. Enrichment analysis demonstrated enrichment of DEGs in viral response, immune-related (toll-like receptor) biological processes, and metabolic pathways. Numerous investigations have identified associations of viral infections with DM, such as the COVID-19 virus [25]. It has also been found that there are significant IFN-1 signatures in muscles, blood, and skin of DM patients [22], and IFN-1 production is primarily mediated by the TLR pathway [26]. Dermatomyositis patients exhibit enhanced expression of TLR2 and TLR4 in monocyte subsets, which is associated with disease activity and unique clinical features, including dysphagia, interstitial lung disease (ILD), vasculopathy, and pro-inflammatory cytokines [27]. These immunological characteristics may serve as potential diagnostic tools and novel biomarkers of disease activity in DM.
The interpretation of the pathogenesis of DM is a hot topic of research. For instance, in the study conducted by Aljabban et al. [28], they primarily analyzed the pathways and genes involved in DM regulation and identified several upregulated genes belonging to the TRIM family in DM samples. In contrast, this study primarily focuses on constructing a diagnostic model for DM with the aim of providing guidance for its clinical diagnosis. We used LASSO and ROC curves to identify and validate ACKR1, DHX58, IRF7, ISG15, and PSMB8 as potential diagnostic biomarkers. Previous studies have shown that ACKR1 can serve as a diagnostic biomarker for cervical cancer [29]. DHX58 can enhance osteogenic differentiation of osteoblasts via the Wnt/β-catenin pathway [30]. IRF7 may be key in inflammatory responses and is a potential target for DM therapy [31]. ISG15 is a ubiquitin-like modifier, and it is substantially elevated in DM compared to non-DM samples and binds to proteins in DM with perifascicular atrophy [32]. PSMB8 is the 20S proteasome subunit β8, and mutations in PSMB8 are associated with systemic autoimmune inflammatory diseases, including DM [33]. In our study, ACKR1, DHX58, IRF7, ISG15, PSMB8, and the constructed diagnostic model all showed good diagnostic performance. In summary, these diagnostic biomarkers can be used to predict the progression and prognosis of DM. Additionally, based on these biomarkers, new treatment approaches or drugs can be developed to improve the prognosis and quality of life for patients. However, the functions and molecular regulatory mechanisms of these genes in DM are still elusive and require further research.
The extent of immune cell infiltration can serve as an important indicator for predicting patient prognosis. In our study, we found that M1 and M2 macrophages were upregulated in DM, while plasma cells, Tregs, and resting dendritic cells were downregulated. Studies have shown that macrophage infiltration is elevated in DM compared to normal samples and is closely related to the severity of the disease [34]. Another study revealed that M1 and M2 macrophages are significantly upregulated in DM, while plasma cells and Tregs are significantly downregulated, which is congruous with our research findings [35]. Macrophage-secreted cytokines may be implicated in DM [36]. Hence, macrophage dysregulation may be another pathogenic mechanism of DM. Furthermore, immunoglobulin deposits in muscle tissue have been demonstrated in idiopathic inflammatory myopathies, suggesting the involvement of plasma cells in muscle inflammation [37]. Treg cells are a subpopulation of CD4+ T cells that are crucial to the anti-inflammatory response in skeletal muscle and skin, and an imbalance between Th17 and Treg is linked to DM [38-40]. Additionally, we found that most HLA genes were highly expressed in DM samples, which is congruous with the findings of Gao et al. [8], who reported that individuals with specific HLA types were more susceptible to DM. Therefore, it is evident that the dynamic changes in immune cells are crucial indicators of disease severity. By assessing the infiltration of immune cells, healthcare professionals can evaluate the patient’s condition and develop individualized treatment plans.
Our study has some limitations. Firstly, although the diagnostic model we constructed is clinically significant, further validation is needed by recruiting patients to provide DM samples. Secondly, we only proposed a correlation between immune cell infiltration and diagnostic genes, and mechanisms by which genes affect immune cells need to be investigated through experimental design. Finally, although we have experimentally verified the expression level of diagnostic genes, further experimental investigation of the mechanism is needed.