
Introduction
Systemic lupus erythematosus (SLE) is one of the most representative prototypes of autoimmune diseases, characterized by abnormalities of immunological tolerance, leading to the production of multiple autoantibodies and multi-organ damage in patients [1, 2]. T cells play a pivotal role in initiating the inflammatory cascade in SLE, contributing to the production of pro-inflammatory cytokines and the targeting of host tissues. T cell dysfunction is intricately linked to the immunopathogenesis of SLE, including biochemical, molecular, and metabolic abnormalities [3, 4]. Targeting glucose metabolism has been shown to facilitate disease remission [5, 6].
T cells exhibit distinct developmental and functional subsets, each potentially characterized by unique metabolic requirements [7], in line with the perception that distinct immune functions are determined by distinct phenotypes of energy sensing, generation and utilization [8]. Advancements in metabolic reprogramming research have demonstrated a potential treatment for SLE. Previous studies verified that rapamycin could regulate the ratio of T regulatory (Treg)/T helper (Th)17 cells by decreasing the glucose catabolism and lipid anabolism, and ameliorate SLE in vivo by inhibiting mammalian target of rapamycin complex 1 (mTORC1) [9]. Torigoe et al. [10] demonstrated that 2-deoxyglucose (2-DG) could inhibit the differentiation of Th17 cells via decreasing the glycolytic pathway to improve disease status in a mouse SLE model. Similarly, researchers reported that metformin and N-acetylcysteine could increase Treg cells and reduce Th17 cells by inhibiting the oxidative phosphorylation (OXPHOS) pathway [6, 11, 12]. Combined treatment with metformin and 2-DG has also shown promising results in lupus-susceptible mice by reducing interferon γ (IFN-γ) production and the anti- dsDNA antibody titer [13]. Notably, Treg cells rely on fatty acid metabolic pathways, and targeting T cell glycolysis has been demonstrated to specifically reduce the production of Th cells without affecting Tregs [14]. Therefore, targeting glucose metabolism has emerged as a promising approach in facilitating disease remission [5, 6].
Glycolysis and OXPHOS are the two main ways in which organisms produce ATP. Glycolysis is the process in which cells produce energy under insufficient oxygen conditions, while OXPHOS is a process by which cells use carbon fuels and oxygen to generate ATP in mitochondria. The metabolic switch between glycolysis and OXPHOS in CD4+ T cells is a dynamic process depending on the cell state [15]. CD4+ T cells rely on glycolysis for inflammatory effector functions, but recent studies have shown that mitochondrial metabolism supports their chronic activation. Under homeostasis, non-activated CD4+ T cells remain relatively static and rely on mitochondrial OXPHOS [16]. When confronted with corresponding antigen, non-activated CD4+ T cells are activated and exhibit increased glycolysis and mitochondrial metabolism. In progressive SLE, activated CD4+ T cells prominently display a metabolic shift from OXPHOS towards aerobic glycolysis to sustain heightened biological processes such as antigen recognition, presentation, and cellular differentiation [17-19]. In contrast, quiescent CD4+ T cells rely predominantly on OXPHOS to maintain cell morphology and function [20]. However, the precise association between CD4+ T cell metabolism and disease activity requires further investigation.
This study aimed to reveal the difference of glucose metabolic phenotype of CD4+ T cells between SLE patients and healthy individuals, and explore the potential clinical correlations between disease activity and immunometabolism in SLE.
Material and methods
Study population
The study included 20 untreated SLE patients and 20 healthy volunteers as controls. All patients with SLE in the study met the revised American College of Rheumatology (ACR) criteria and the Systemic Lupus International Collaborating Clinics (SLICC) criteria [21]. Patients were excluded if they had any of the following conditions: 1) infectious, metabolic or other autoimmune diseases, 2) severe life-threatening diseases (e.g. malignancy, organ failure), 3) chronic diseases (e.g. hypertension or chronic obstructive pulmonary disease), 4) metformin users, 5) history of graft-versus-host disease or allergic diseases, 6) prior radiotherapy to the face, head or neck. This study was approved by the Ethics Committee of the Second Hospital of Hebei Medical University (2021-R392) on May 27th, 2021. All participants provided written informed consent prior to enrollment in the study. Details that might disclose the identity of the subjects under study have been omitted. This research strictly adhered to the World Medical Association’s Declaration of Helsinki.
Clinical data included demographic characteristics including age, gender, body mass index (BMI), systemic involvement (skin rash, arthritis, hematological system, renal system and nervous system), lactic dehydrogenase (LDH), numbers of immune cell subsets as well as immune indexes (e.g. auto-antibodies, immunoglobulins, complements), and serum cytokines. The Systemic Lupus Erythematosus Disease Activity Index-2000 (SLEDAI-2K) was used for clinical disease assessment, with severity categorized as follows: severe active disease (SLEDAI-2K > 12), moderate (7 ≤ SLEDAI-2K ≤ 12), and mild (SLEDAI-2K ≤ 6).
Flow cytometry analysis
Cell suspensions were prepared from venous blood collected at 6 a.m. from SLE patients and healthy controls (HCs) after an eight-hour fast. Phenotypic cell analyses were performed by co-staining peripheral blood mononuclear cells with fluorochrome-labeled monoclonal anti- bodies (mAbs) to CD3, CD4, CD8 and CD45 according to standard protocols and reference [22]. All mAbs were sourced from Beckman Coulter and Becton Dickinson, USA. Cells were analyzed on a NAVIOS flow cytometer (Beckman Coulter, USA) using Kaluza software.
Peripheral blood mononuclear cell separation and CD4+ T cell isolation
Peripheral blood mononuclear cells (PBMCs) were isolated by density gradient centrifugation using Lymphoprep (STEMCELL Technologies). PBMCs were incubated with Anti-Human CD4 Particles-DM (BD Biosciences, 50 µl of particles for every 107 total cells), and positively selected from the PBMCs by magnetic separation with a Cell Separation Magnet (BD Biosciences). The purity of CD4+ T cells from PBMCs exceeded 98%, as confirmed by flow cytometry analysis. Subsequently, CD4+ T cells were co-cultured in the presence of 10 µg/ml CD3 and 5 µg/ml CD28 antibodies (Leinco Technologies) for 72 hours in vitro and tested without freezing.
Cell Counting Kit-8
The Cell Counting Kit-8 (SB-CCK8M, Share-bio) test was performed in accordance with the manufacturer’s instructions [23].
Cytokine detection
The expression of cytokines was detected by Luminex liquid chip technology according to the instructions of the Bio-Plex Pro Human Cytokine 48-Plex Screening Panel (Bio-Rad).
Extracellular metabolic flux analysis
Real-time metabolic profiles including mitochondrial respiration and glycolysis in fresh CD4+ T cells of SLE patients and HCs were determined using an Agilent seahorse XF24 analyzer (Agilent Technologies). Mitochondrial respiration was measured by oxygen consumption rate (OCR) and used as a quantitative metric of mitochondrial function via OXPHOS. The extracellular acidification rate (ECAR) is a measurable parameter often used in cell biology to estimate glycolytic activity. A total of 5 × 10⁵ CD4+ T cells per well were seeded in a plate precoated with poly-D-lysine hydrobromide (BD Biosciences, USA). The assay medium was supplemented with Seahorse XF RPMI medium, containing 1 mM pyruvate, 2 mM glutamine, and 10 mM glucose. For the ECAR assay, rotenone/antimycin A (0.5 µM) and 2-deoxy-glucose (50 mM) were sequentially added to assess glycolytic proton efflux rate (glycoPER). For the Mito Stress test, oligomycin (1.5 µM), carbonyl cyanide 4-(trifluoromethoxy) phenylhydrazone (2.0 µM) and rotenone/antimycin A (0.5 µM) were added sequentially to assess spare respiratory capacity (SRC).
Statistical analysis
Metabolic data analysis was conducted using the Agilent Seahorse Mito Stress Test and Glycolytic Rate Assay Report Generator from Wave software (Agilent Technologies). Cytokine data analysis was performed using MILLIPLEX Analyst.V5.1. Quantitative data with normal distribution were expressed as mean ± standard deviation (SD). Quantitative data with skewed distribution were expressed by M (Q1-Q3). The two-tailed t-test was used to compare normally distributed data, and the Mann-Whitney test was used to compare data with non-normal distribution. For multiple comparisons, an analysis of variance (ANOVA) was applied. R values were calculated based on the analysis of Pearson’s or Spearman’s correlation. All statistical tests were analyzed using GraphPad Prism (v.9) software. P values < 0.05 were considered statistically significant.
Results
Demographic and clinical characteristics
A total of 20 untreated SLE patients with disease duration less than one year were enrolled in this study, including three males and 17 females, with a mean age of 30.4 ±12.5 years and BMI 21.8 ±4.2 kg/m2. Among them, eight patients had skin and mucosal damage, six had arthritis, six had neuropsychiatric symptoms, nine had proteinuria, and 19 had hematological system involvement. In terms of immune indicators, 14 (70%) had positive anti-dsDNA antibody, 14 (70%) had decreased complement, nine (45%) had increased lupus anticoagulant, seven (35%) had increased anti-cardiolipin antibody, eight (40%) had increased β2 glycoprotein I antibody and 10 (50%) had positive anti-Smith antibody. According to SLEDAI-2K, SLE patients were divided into severe (n = 8), moderate (n = 7) and mild (n = 5) activity groups. Additionally, the study also included a control group of 20 healthy subjects, including four males and 16 females, with a mean age of 31.9 ±4.9 years and BMI of 21.0 ±2.9 kg/m2 (Table 1 and Supplementary Fig. 1).
Table 1
Demographic and clinical characteristics
Reduced peripheral lymphocytes and sub-populations, elevated cytokine production and LDH activity in SLE patients
The numbers of peripheral blood lymphocytes, T cells and CD4+ T cells in SLE patients were significantly lower than those in HCs (all p < 0.001) (Table 2 and Supplementary Fig. 2). In particular, the number of CD4+ T cells was significantly negatively correlated with SLEDAI-2K (p = 0.004, r = –0.62) (Fig. 1), suggesting that the number of CD4+ T cells reflects disease activity in SLE.
Table 2
Lymphocytes, T cells, CD4+ T cell numbers, proliferation and cytokine expression in patients and healthy controls
Fig. 1
Correlations among concentration of plasma cytokines. Correlations among plasma cytokines, including SLE, SLEDAI-2K, CD4+ T cell numbers, LDH levels, SRC, compensatory glycolysis levels, etc., were calculated. *p < 0.05, **p < 0.01, ***p < 0.001. LDH – lactic dehydrogenase, SRC – spare respiration capacity, SLEDAI- 2K – Systemic Lupus Erythematosus Disease Activity Index-2000
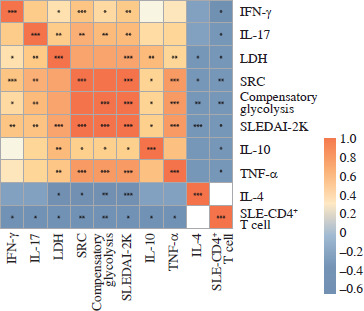
As cytokines play a crucial role in the abnormal immune response of SLE, so the association between cytokines and disease activity was detected. We investigated cytokine levels in plasma and culture supernatants. The plasma concentrations of interleukins (IL-2, IL-4, IL-6, IL-10, IL-17), tumor necrosis factor α (TNF-α) and IFN-γ were all elevated in SLE patients compared to HCs (all p < 0.05) (Table 2). The levels of the pro-inflammatory cytokines IL-10, IL-17, TNF-α and IFN-γ were positively correlated with SLEDAI-2K (all p < 0.05, r = 0.56, 0.64, 0.76 and 0.60, respectively) and negatively correlated with the numbers of SLE-CD4+ T cells (all p < 0.05, r = –0.59, –0.58, –0.54 and –0.46, respectively). In contrast, the expression of anti-inflammatory cytokine IL-4 was negatively correlated with SLEDAI-2K in the plasma (p < 0.001, r = –0.68) (Fig. 1). In addition, the concentrations of IL-4, IL-5, IL-8, IL-10, IL-17, TNF-α, IFN-γ and granulocyte macrophage colony stimulating factor (GM-CSF) in the culture supernatants of activated SLE-CD4+ T cells were significantly elevated compared to HCs (all p < 0.05) (Table 2).
Lactic dehydrogenase is one of the critical catalytic enzymes of glycolysis, and its levels can affect the production of lactate and pyruvic acid, thus maintaining the balance between glycolysis and the OXPHOS pathway [24, 25]. The peripheral LDH level in SLE patients was positively correlated with SLEDAI-2K (p < 0.001, r = 0.77), but negatively correlated with the numbers of SLE-CD4+ T cells (p = 0.01, r = –0.58). Moreover, the peripheral LDH level was positively correlated with pro-inflammatory plasma cytokines IL-10, IL-17, TNF-α and IFN-γ (all p < 0.05, r = 0.63, 0.61, 0.62 and 0.47, respectively), but negatively correlated with IL-4 (p = 0.01, r = –0.52) (Fig. 1). These results demonstrated a distinct role of glucose metabolism in peripheral CD4+ T cells of SLE patients.
SLE-CD4+ T cells displayed enhanced proliferation capacity
To delineate proliferation capacity of the activated CD4+ T cells, we observed that after 72 hours of co-culture with CD3/CD28, the optical density (OD) determined by CCK-8 assay of CD4+ T cells from SLE patients was markedly higher than that from HCs (p < 0.001) (Table 2).
SLE-CD4+ T cells exhibited higher OXPHOS levels
Mitochondrial dysfunction-derived aberrant glucose metabolism is known to be associated with T cell fate and function [26]. To illustrate the glucose metabolic reprogramming profiles in CD4+ T cells after activation, we first conducted the Mito Stress test. The results showed that activated SLE-CD4+ T cells exhibited higher basic and maximal OCR, ATP production, and spare respiratory capacity (SRC), compared to HCs (all p < 0.001) (Fig. 2A, B and Table 3). Additionally, we further analyzed the OXPHOS levels of SLE-CD4+ T cells across different disease activities. Compared to HCs, the mitochondrial oxidative capacity and the ATP production of SLE-CD4+ T cells in moderate and severe disease activity groups were significantly elevated (all p < 0.01) (Fig. 2C-G and Table 3). Notably, the SRC of SLE-CD4+ T cells was positively correlated with SLEDAI-2K (p < 0.001, r = 0.94) and negatively correlated with the numbers of activated CD4+ T cells in SLE (p = 0.003, r = –0.64) (Fig. 1). We also in- vestigated the correlation between SRC and plasma cytokines in SLE patients. As shown in Figure 1, the levels of IL-10, IL-17, TNF-α and IFN-γ were positively correlated with SRC (all p < 0.05, r = 0.54, 0.71, 0.81 and 0.63, respectively), while IL-4 was negatively correlated with SRC (p = 0.01, r = –0.58). These findings suggested that the SLE-CD4+ T cells exhibit elevated OXPHOS profiles, which may contribute to the onset and progression of SLE.
Fig. 2
Mitochondrial OCR of CD4+ T cells in patients with SLE and healthy controls. A) The OCR of CD4+ T cells in SLE patients and healthy controls. B) Basal respiration, maximal respiration, spare respiration capacity and ATP production of CD4+ T cells in SLE patients and healthy controls. **p < 0.01, ***p < 0.001. HC – healthy controls, OCR – oxygen consumption rate, FCCP – mitochondrial oxidative phosphorylation carbonyl cyanide 4-(trifluoromethoxy) phenylhydrazone, Rot/AA – rotenone/antimycin A C) OCR of CD4+ T cells in SLE patients with different disease activities and healthy controls. D-G) ATP production, basal respiration, maximal respiration and spare respiration of of CD4+ T cells in SLE patients with different disease activities and healthy controls (SLE-mild n = 5, SLE-moderate n = 7, SLE-severe n = 8). **p < 0.01, ***p < 0.001. HC – healthy controls, OCR – oxygen consumption rate, FCCP – mitochondrial oxidative phosphorylation carbonyl cyanide 4-(trifluoromethoxy) phenylhydrazone, Rot/AA – rotenone/antimycin A
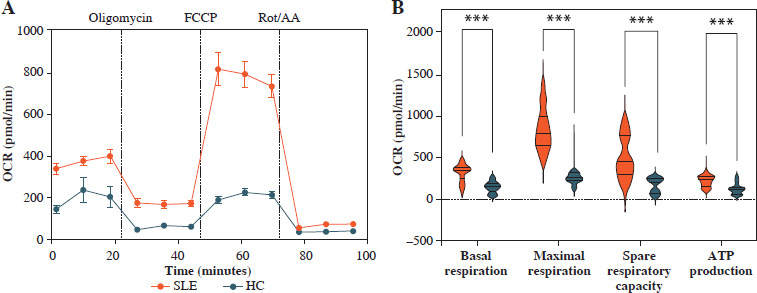
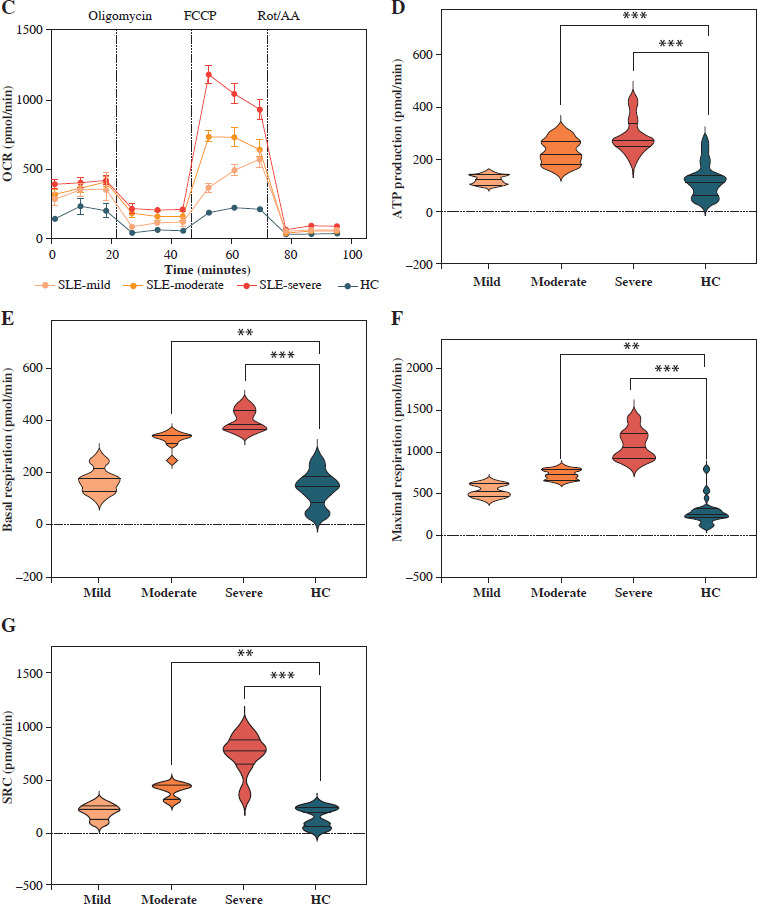
Table 3
Extracellular metabolic flux indices of CD4+ T cells
SLE-CD4+ T cells showed increased glycolysis levels
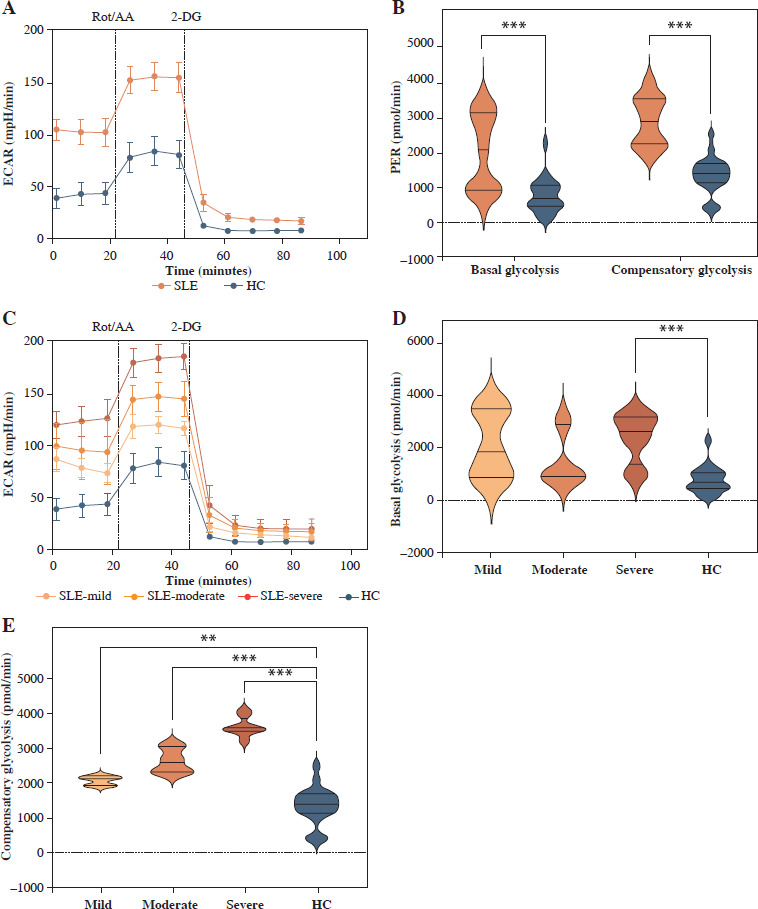
Besides mitochondrial OXPHOS, glycolysis is one of the most common energy sources in the metabolic pathway for immune cells [4]. We next conducted the real- time Glycolytic Rate Assay (GRA) simultaneously in vitro. Compared to HCs, the glycolytic proton efflux rates (glycoPER) of basal and compensatory glycolysis were significantly elevated in CD4+ T cells from SLE patients (p < 0.001) (Fig. 3A, B and Table 3). We further compared the ECAR of SLE-CD4+ T cells at different levels of disease activity. The results showed that the basal glycoPER was significantly higher in the severe disease activity group than the healthy group (p < 0.001) (Fig. 3C, D and Table 3). Additionally, the compensatory glycoPER was significantly higher in the mild, moderate and severe disease activity groups compared to HCs (all p < 0.01) (Fig. 3C, E and Table 3). The compensatory glycolysis was positively correlated with SLEDAI-2K (p < 0.001, r = 0.95) and negatively correlated with SLE-CD4+ T cell numbers (p = 0.003, r = –0.64) (Fig. 1). Additionally, the plasma expression levels of IL-10, IL-17, TNF-α and IFN-γ in SLE patients were positively correlated with compensatory glycolysis (all p < 0.05, r = 0.54, 0.67, 0.79 and 0.51, respectively), while IL-4 level presented opposite changes (p = 0.003, r = –0.63) (Fig. 1). These results indicated that the up-regulated glycolysis levels of SLE-CD4+ T cells reflected the disease activity.
Fig. 3
Glycolysis extracellular acidification rate of CD4+ T cells in SLE patients and healthy controls. A) ECAR of CD4+ T cells in SLE patients and healthy controls. B) Basal glycolysis and compensatory glycolysis of CD4+ T cells in SLE patients and healthy controls. C) ECAR of CD4+ T cells in SLE patients with different disease activities and healthy controls. D, E) Basal glycolysis and compensatory glycolysis of CD4+ T cells in SLE patients with different disease activities and healthy controls. (SLE-mild n = 5, SLE-moderate n = 7, SLE-severe n = 8). **p < 0.01, ***p < 0.001. ECAR – glycolysis extracellular acidification rate, PER – proton efflux rate, HC – healthy controls, Rot/AA – rotenone/antimycin A, 2-DG – 2-deoxyglucos
Discussion
Systemic lupus erythematosus is a heterogeneous immune disease characterized by impaired self-tolerance and immunomodulation [27]. CD4+ T cell immunometabolism plays a key role in the onset and development of SLE, although the specific relationship between SLE-CD4+ T cell glucose metabolism and disease activity remains unknown [1, 20, 28]. In our study, we investigated the glucose metabolic profiles of CD4+ T cells in SLE patients and initially explore the correlation between glucose metabolism and disease severity.
As a key catalytic enzyme in the glycolytic pathway, LDH is involved in glucose metabolic changes, which may act as a driving factor by modulating proliferation, differentiation and cytokine production of T cells to influence the immune response in SLE [25]. Our study indicated that the LDH levels were negatively correlated with decreased numbers of SLE-CD4+ T cells, and positively correlated with disease activity. Shan et al. [24] found that activated LDH tilted the Th17/Treg cell balance towards Th17 with higher levels of IL-17, which was similar to our observations. Moreover, we found that LDH was positively correlated with SLEDAI-2K, but negatively correlated with SLE-CD4+ T cell numbers. These findings suggest that the reprogramming of glucose metabolism influences the differentiation of T cell subsets and the production of cytokines, ultimately contributing to the promotion of SLE.
Glucose metabolic rates are intricately linked to the immune function of CD4+ T cells [29]. Our understanding of glucose metabolic activity mainly derives from exploring mitochondrial dysfunction and ATP consumption. Differences in mitochondrial utilization of glucose reflect the impaired glucose metabolism of T cells in SLE [30, 31]. When stimulated, T cells were characterized by a higher oxidative status and ATP depletion [32]. However, there exists a contradiction between mitochondrial dysfunction and high ATP consumption [33, 34]. The transition from OXPHOS to the aerobic glycolysis pathway produced more ATP for biogenic demands. To assess the effects of glucose metabolic rewiring on CD4+ T cells in SLE, we therefore evaluated the glucose metabolic profiles of SLE-CD4+ T cells and found that the activated SLE-CD4+ T cells exhibited increased OXPHOS and aerobic glycolysis compared to HCs, which was similar to the findings of Zou et al. and Roach et al. [5, 35]. As shown in the OCR analysis, the SRC of the SLE group was significantly higher than that of controls. Additionally, ECAR analysis revealed that CD4+ T cells in SLE exhibited a higher glycolytic capacity compared to controls. Moreover, previous studies have shown the potential of metabolic interventions. Yin et al. [6] reported that treatment with 2-DG, a glycolysis inhibitor, effectively reversed early disease in lupus-prone mouse models. Metformin, an inhibitor of complex I of the mitochondrial respiratory chain, could increase Treg cells and reduce Th17 cells to promote SLE remission [36, 37]. N-acetylcysteine, another inhibitor of complex I, could inhibit lymphocyte oxygen consumption in SLE by regulating the mTOR pathway [11, 12]. Taken together, these findings suggested that SLE-CD4+ T cells displayed an abnormal glucose metabolic profile, and targeting glucose metabolic therapy may be a viable therapeutic strategy to alleviate SLE.
Numerous studies have reported glucose metabolism alterations in SLE, but only a few have examined the links between glucose metabolism levels and SLE disease activity. In this study, we observed the changes of glucose metabolism in patients with different SLE activity. For patients with moderate and severe SLE activity, the SRC and compensatory glycolysis were significantly elevated compared with controls, while no differences were observed in the mild SLE group. Interestingly, ECAR showed that the basal glycolysis in the moderate SLE group was lower than in the mild SLE group. The reduction of basal glycolysis in moderate SLE patients may be attributed to the fact that they had a shorter disease duration than patients in the mild SLE group and that the sample size of the study was insufficient. In our study, we further observed that the glucose metabolic capacity of CD4+ T cells in SLE was positively correlated with SLEDAI-2K and pro-inflammatory cytokines IFN-γ, TNF-α, IL-10 and IL-17, but negatively correlated with CD4+ T cell numbers. These data suggest that aberrant glucose metabolism in CD4+ T cells may be involved in the onset and progression of SLE. Therefore, the glucose metabolic profile of CD4+ T cells might serve as a promising biomarker for SLE disease activity.
This study had some limitations. In our study, some SLE patients in our cohort presented two or more coexisting systemic damage. It remains unclear whether specific organ damage contributes to distinct changes in CD4+ T cell glucose metabolism, warranting further investigation. Moreover, as the data were collected during the COVID-19 epidemic period, limited samples of patients may have increased the differences among groups. Additionally, in vitro studies and in vivo experiments in lupus-susceptible animals are needed to further explore the molecular regulatory mechanism based on energy metabolism phenotype.
In summary, this study revealed a distinct profile of glucose metabolic reprogramming in CD4+ T cells from SLE, which was correlated with disease activity. Targeting T cell glucose metabolism might serve as a novel therapeutic strategy, offering novel approaches for the evaluation, prevention and precise treatment of SLE.